OPEN-SOURCE SCRIPT
SPY Master v1.0
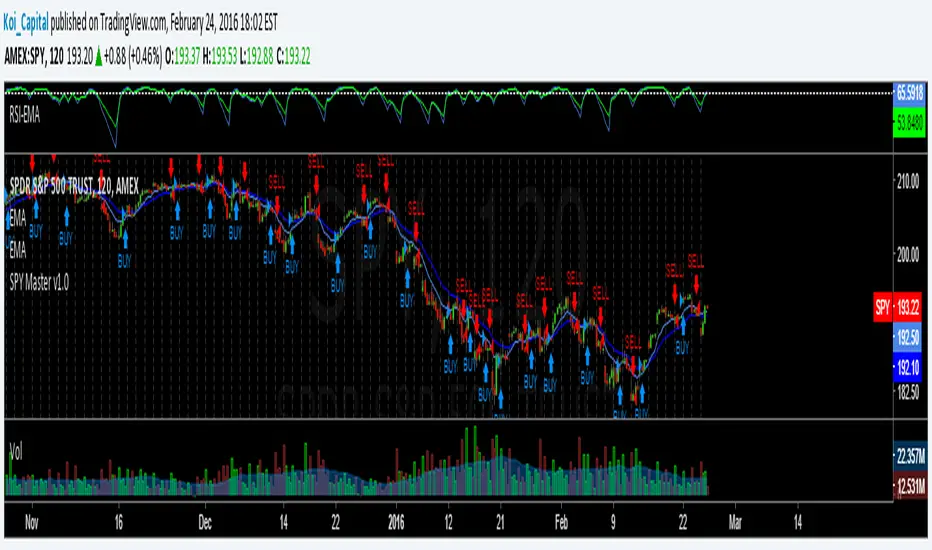
This is a simple swing trading algorithm that uses a fast RSI-EMA to trigger buy/cover signals and a slow RSI-EMA to trigger sell/short signals for SPY, an xchange-traded fund for the S&P 500.
The idea behind this strategy follows the premise that most profitable momentum trades usually occur during periods when price is trending up or down. Periods of flat price actions are usually where most unprofitable trades occur. Because we cannot predict exactly when trending periods will occur, the algorithm basically bets money on all trade opportunities during all market conditions. Despite an accuracy rate of only 40%, the algorithm's asymmetric risk/reward profile allows the average winner to be 2x the average loser. The end result is a positive (profitable) net payout.
TRADING RULES:
Buy/Cover = EMA3(RSI2) cross> 50
Sell/Short = EMA5(RSI2) cross< 50
BACKTEST SETTINGS:
- Period = March 2011 - Present
- Initial capital = $10,000
- Dividends excluded
- Trading costs excluded
PERFORMANCE COMPARISON:
There are 657 trades, which means 1,314 orders. Assuming each order costs $2 (what I pay for at Interactive Brokers), total trading costs should be $2,628.
-SPY (buy & hold) = 132.73 ---> 193.22 = +45.57% (dividends excluded)
-SPY Master v1.0 = $12,649 - $2,628 = $10,021 = +100.21%
DISCLAIMER: None of my ideas and posts are investment advice. Past performance is not an indication of future results. This strategy was constructed with the benefit of hindsight and its future performance cannot be guaranteed.
Open-source script
In true TradingView spirit, the creator of this script has made it open-source, so that traders can review and verify its functionality. Kudos to the author! While you can use it for free, remember that republishing the code is subject to our House Rules.
Kory Hoang (stably.io)
Disclaimer
The information and publications are not meant to be, and do not constitute, financial, investment, trading, or other types of advice or recommendations supplied or endorsed by TradingView. Read more in the Terms of Use.