OPEN-SOURCE SCRIPT
Updated [_ParkF]Fractal
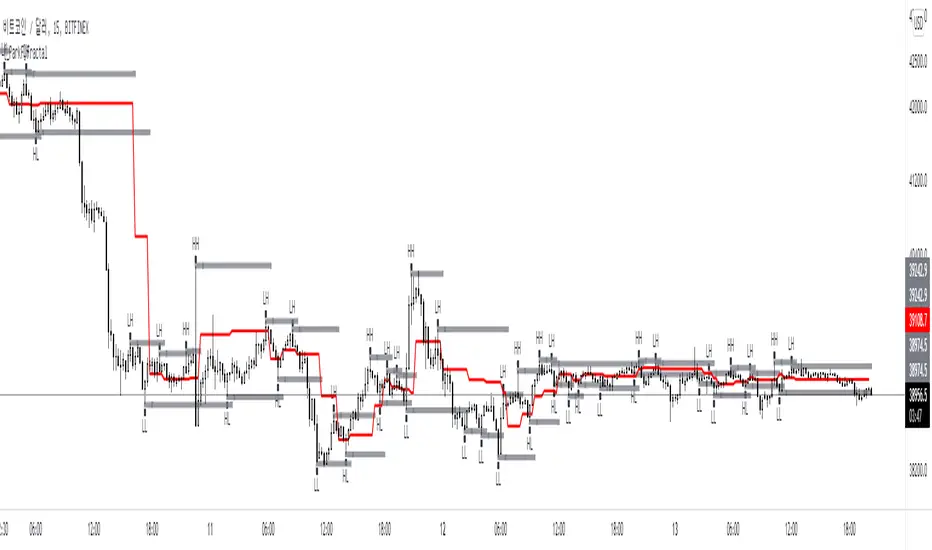
Top gray line is the fractal resistance.
Bottom gray line is the fractal support.
Central red line is the average of the top&bottom fractal.
Fractals can be displayed as support and resistance, and the red fractal average line indicates a trend.
상단 회색선은 프랙탈 저항,
하단 회색선은 프랙탈 지지,
중앙 빨간선은 프랙탈 상,하단의 평균,
프랙탈은 지지와 저항으로 표시되고 빨간색 프랙탈 평균선은 추세입니다.
Bottom gray line is the fractal support.
Central red line is the average of the top&bottom fractal.
Fractals can be displayed as support and resistance, and the red fractal average line indicates a trend.
상단 회색선은 프랙탈 저항,
하단 회색선은 프랙탈 지지,
중앙 빨간선은 프랙탈 상,하단의 평균,
프랙탈은 지지와 저항으로 표시되고 빨간색 프랙탈 평균선은 추세입니다.
Release Notes
add titleOpen-source script
In true TradingView spirit, the creator of this script has made it open-source, so that traders can review and verify its functionality. Kudos to the author! While you can use it for free, remember that republishing the code is subject to our House Rules.
Disclaimer
The information and publications are not meant to be, and do not constitute, financial, investment, trading, or other types of advice or recommendations supplied or endorsed by TradingView. Read more in the Terms of Use.
Open-source script
In true TradingView spirit, the creator of this script has made it open-source, so that traders can review and verify its functionality. Kudos to the author! While you can use it for free, remember that republishing the code is subject to our House Rules.
Disclaimer
The information and publications are not meant to be, and do not constitute, financial, investment, trading, or other types of advice or recommendations supplied or endorsed by TradingView. Read more in the Terms of Use.