OPEN-SOURCE SCRIPT
Updated Uptrend Strength Checklist Dashboard
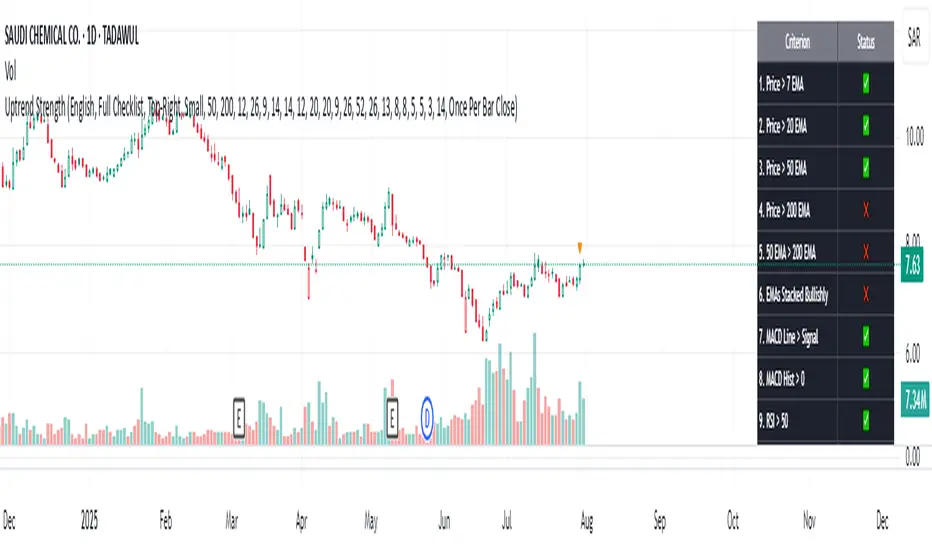
The Uptrend Strength Checklist Dashboard is a powerful visual tool designed to help traders quickly evaluate the strength and quality of an uptrend using a combination of 20 widely-used technical conditions. It displays a clean, color-coded dashboard directly on the chart, summarizing key trend indicators in real-time.
🧠 What It Does:
This script checks 20 bullish criteria across different categories—momentum, trend alignment, volume, and price action. Each condition is scored individually and shown in a dashboard with checkmarks ✅ (condition met) or ❌ (condition not met).
The total score out of 20 is then used to interpret the trend strength into 4 levels:
📋 Checklist Criteria Includes:
🌐 Multilingual Support:
Supports both English and Arabic (العربية) language options, with all labels, tooltips, and trend messages dynamically translated based on user selection.
🎨 Customization Options:
✅ Perfect For:
🔔 Note: This indicator does not generate buy/sell signals on its own but provides a visual checklist to help confirm the strength of an uptrend. Use it in conjunction with your entry/exit strategy and risk management rules.
🧠 What It Does:
This script checks 20 bullish criteria across different categories—momentum, trend alignment, volume, and price action. Each condition is scored individually and shown in a dashboard with checkmarks ✅ (condition met) or ❌ (condition not met).
The total score out of 20 is then used to interpret the trend strength into 4 levels:
- 🔥 Very Strong Uptrend (18–20 points)
- 👍 Strong Uptrend (14–17 points)
- 🤔 Possible Uptrend Forming (8–13 points)
- 📉 Weak or No Uptrend (0–7 points)
📋 Checklist Criteria Includes:
- Price above short/medium/long EMAs (7, 20, 50, 200)
- EMAs stacked in bullish order
- MACD Line & Histogram
- RSI > 50 and ROC > 0
- ADX > 25 and +DI > -DI
- OBV trend and Bullish Volume Dominance
- Price above Ichimoku Cloud, Tenkan > Kijun
- Parabolic SAR bullish signal
- Williams Alligator confirmation
- Price > Bollinger Band Midline
- Price > Previous Week’s High
🌐 Multilingual Support:
Supports both English and Arabic (العربية) language options, with all labels, tooltips, and trend messages dynamically translated based on user selection.
🎨 Customization Options:
- Choose table position and size on chart
- Customize all trend and table colors
- Adjust all indicator input lengths to suit your strategy
✅ Perfect For:
- Trend-following traders
- Swing and position traders
- Technical analysts looking for a structured signal confirmation tool
🔔 Note: This indicator does not generate buy/sell signals on its own but provides a visual checklist to help confirm the strength of an uptrend. Use it in conjunction with your entry/exit strategy and risk management rules.
Release Notes
📊New Dashboard Display ModeNow You can customize the dashboard appearance on your chart. A new "Display Mode" option has been added to the settings, allowing you to choose between two views:
- Full Checklist: The original, detailed view showing all 20 technical criteria and their status (✅/❌).
- Scores Only: A new, compact view that displays only the final Score and Trend interpretation. This is ideal for a cleaner chart layout.
🚀 Customizable Score Alerts
The dashboard is no longer just a visual tool. A new "Alert Settings" section has been added, enabling you to:
Set a Trigger Score: You can define the minimum score (from 1 to 20) that must be reached to trigger an alert. For example, set it to 14 to be alerted only for "Strong" or "Very Strong" uptrends.
Control Alert Frequency: Choose whether the alert should fire intra-bar (Once Per Bar) or only on the candle's close (Once Per Bar Close).
Note: The alert is intelligently designed to trigger only on the first bar that crosses above your chosen score threshold. This prevents you from receiving constant, repetitive notifications while the score remains high. The alert message is dynamic, providing the ticker, current score, and trend interpretation in either English or Arabic.
Open-source script
In true TradingView spirit, the creator of this script has made it open-source, so that traders can review and verify its functionality. Kudos to the author! While you can use it for free, remember that republishing the code is subject to our House Rules.
Disclaimer
The information and publications are not meant to be, and do not constitute, financial, investment, trading, or other types of advice or recommendations supplied or endorsed by TradingView. Read more in the Terms of Use.