OPEN-SOURCE SCRIPT
Updated Consecutive Green Candles + 20% Move Screener
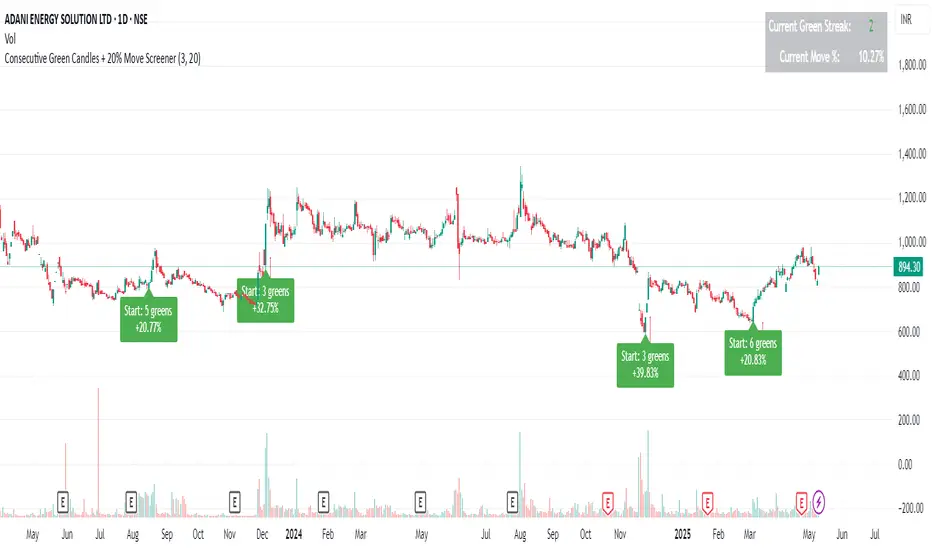
Consecutive Green Candles Momentum Tracker
This indicator identifies powerful bullish momentum streaks in stocks, highlighting opportunities where consistent buying pressure has driven significant price increases.
The script tracks sequences of consecutive green (bullish) candles that collectively move a stock's price by more than 20%. It marks both the beginning of such streaks with a green label and their conclusion with a red arrow when price momentum finally reverses.
Perfect for traders looking to:
- Identify stocks experiencing strong directional momentum
- Spot potential reversal points after extended rallies
- Screen for securities with recent bullish strength
- Understand the magnitude of recent price runs
Simply adjust the minimum number of candles and percentage threshold to match your preferred momentum criteria.
Release Notes
Consecutive Green Candles Momentum TrackerThis indicator identifies powerful bullish momentum streaks in stocks, highlighting opportunities where consistent buying pressure has driven significant price increases.
The script tracks sequences of consecutive green (bullish) candles that collectively move a stock's price by more than 20%. It marks both the beginning of such streaks with a green label and their conclusion with a red arrow when price momentum finally reverses.
Perfect for traders looking to:
- Identify stocks experiencing strong directional momentum
- Spot potential reversal points after extended rallies
- Screen for securities with recent bullish strength
- Understand the magnitude of recent price runs
Simply adjust the minimum number of candles and percentage threshold to match your preferred momentum criteria.
Release Notes
Fixed a minor bug.Open-source script
In true TradingView spirit, the creator of this script has made it open-source, so that traders can review and verify its functionality. Kudos to the author! While you can use it for free, remember that republishing the code is subject to our House Rules.
Disclaimer
The information and publications are not meant to be, and do not constitute, financial, investment, trading, or other types of advice or recommendations supplied or endorsed by TradingView. Read more in the Terms of Use.
Open-source script
In true TradingView spirit, the creator of this script has made it open-source, so that traders can review and verify its functionality. Kudos to the author! While you can use it for free, remember that republishing the code is subject to our House Rules.
Disclaimer
The information and publications are not meant to be, and do not constitute, financial, investment, trading, or other types of advice or recommendations supplied or endorsed by TradingView. Read more in the Terms of Use.