OPEN-SOURCE SCRIPT
Updated Pivot Points Standard

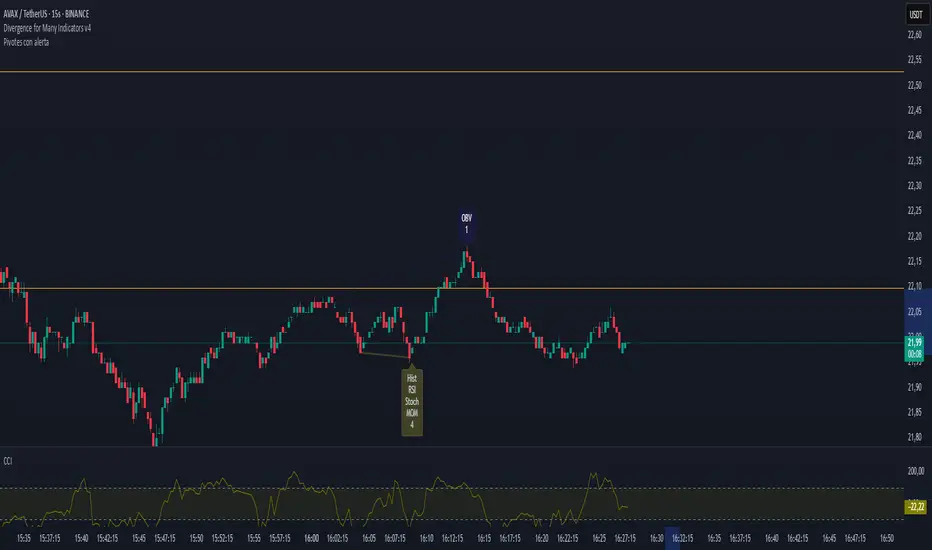
This Pivot Points indicator calculates and plots pivot levels on your chart according to several popular methods (such as Traditional, Fibonacci, Woodie, Classic, Camarilla, etc.), helping traders identify key support and resistance levels. Pivot points are essential tools for predicting market reversal points, and this indicator does so efficiently in real-time.
Features:
Pivot Calculation Methods: Traditional, Fibonacci, Woodie, Classic, Camarilla, and more.
Customization Options: Adjust the pivot type, number of visible pivots, and other parameters like line color and thickness.
Custom Alerts: Receive automatic alerts when the price crosses any pivot level (S1, S2, R1, R2, etc.), helping you react quickly to potential market reversals.
Multiple Timeframe Support: Set the timeframe for the pivot calculations and view corresponding pivot levels for that period.
Visible Pivot Levels: Choose to show or hide the pivot levels directly on the chart, with the option to display the exact price of each level.
Flexible Label Positioning: Select whether pivot labels should appear on the left or right side of the pivot line.
Benefits:
Facilitates Decision-Making: Pivot levels help identify key zones where price is likely to reverse or stay within a range.
Real-Time Alerts: Alerts notify you as soon as the price crosses any key pivot level, enabling you to make quick and precise decisions without constantly monitoring the chart.
Customization: Easily adjust the indicator to suit your trading style and visual preferences.
Ideal For:
Traders looking for technical analysis tools to identify key market levels.
Those who want to receive automatic alerts about pivot level crossovers to streamline decision-making.
Investors using pivot analysis in their trading strategy to determine entry or exit points.
Release Notes
This Pivot Points indicator calculates and plots pivot levels on the chart using various popular methods (such as Traditional, Fibonacci, Woodie, Classic, Camarilla, etc.), helping traders identify key support and resistance levels. Pivot points are essential tools for predicting potential reversal points in the market, and this indicator does it efficiently in real-time.Features:
Pivot Calculation Methods: Traditional, Fibonacci, Woodie, Classic, Camarilla, and more.
Customization Options: Adjust pivot type, the number of visible pivots, and other parameters like line color and thickness.
Custom Alerts: Receive automatic alerts when the price crosses any pivot level (S1, S2, R1, R2, etc.), helping you react quickly to potential market direction changes.
Multiple Timeframe Support: Set the timeframe for pivot calculations and view the corresponding pivot levels for that period.
Visible Pivot Levels: You can choose to show or hide pivot levels directly on the chart, with the option to display the exact price of each level.
Flexible Label Positioning: Choose whether pivot labels should appear on the left or right of the pivot line.
Benefits:
Simplifies Decision Making: Pivot levels help identify key zones where the price is likely to reverse or remain within a range.
Real-time Alerts: Alerts notify you when the price crosses a significant pivot level, allowing you to make fast and precise decisions without constantly monitoring the chart.
Customization: Easily adjust the indicator to fit your trading style and visual preferences.
Ideal for:
Traders looking for technical analysis tools to identify key levels in the market.
Those who want to receive automatic alerts on pivot level crosses to assist in decision-making.
Investors using pivot analysis in their trading strategy to determine entry or exit points.
Open-source script
In true TradingView spirit, the creator of this script has made it open-source, so that traders can review and verify its functionality. Kudos to the author! While you can use it for free, remember that republishing the code is subject to our House Rules.
Disclaimer
The information and publications are not meant to be, and do not constitute, financial, investment, trading, or other types of advice or recommendations supplied or endorsed by TradingView. Read more in the Terms of Use.