OPEN-SOURCE SCRIPT
Yield Curve (2-10yr)
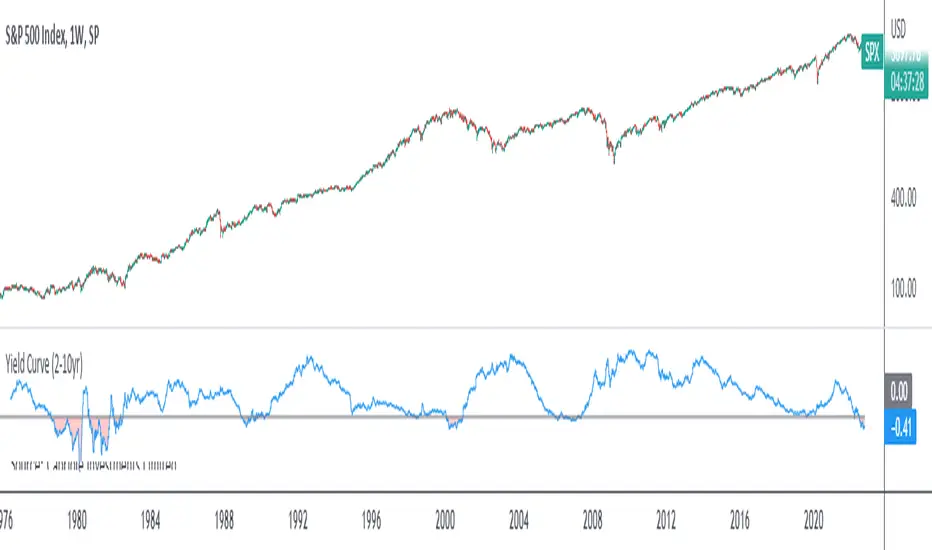
Yield curve of the 2-10 year US Treasury Bonds, with over 50 years of history.
The Yield Curve is the interest rate on the 10 year bond minus the 2 year bond.
When it inverts (crosses under 0) a recession usually follows 6-12 months later.
It's a great leading indicator to identify risk in the macroeconomic environment.
The Yield Curve is the interest rate on the 10 year bond minus the 2 year bond.
When it inverts (crosses under 0) a recession usually follows 6-12 months later.
It's a great leading indicator to identify risk in the macroeconomic environment.
Open-source script
In true TradingView spirit, the creator of this script has made it open-source, so that traders can review and verify its functionality. Kudos to the author! While you can use it for free, remember that republishing the code is subject to our House Rules.
Disclaimer
The information and publications are not meant to be, and do not constitute, financial, investment, trading, or other types of advice or recommendations supplied or endorsed by TradingView. Read more in the Terms of Use.