OPEN-SOURCE SCRIPT
Average Session Range [QuantVue]
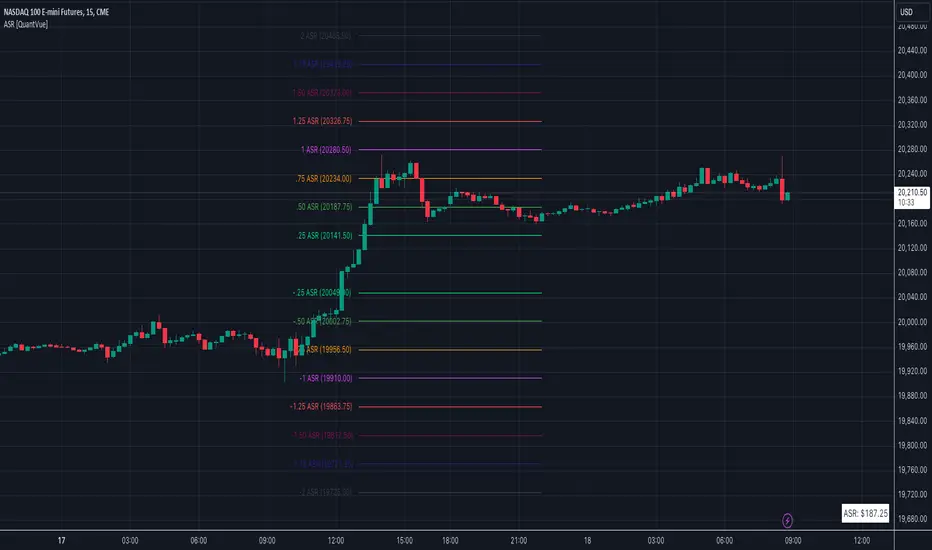
The Average Session Range or ASR is a tool designed to find the average range of a user defined session over a user defined lookback period.
Not only is this indicator is useful for understanding volatility and price movement tendencies within sessions, but it also plots dynamic support and resistance levels based on the ASR.
The average session range is calculated over a specific period (default 14 sessions) by averaging the range (high - low) for each session.
Knowing what the ASR is allows the user to determine if current price action is normal or abnormal.
When a new session begins, potential support and resistance levels are calculated by breaking the ASR into quartiles which are then added and subtracted from the sessions opening price.


The indicator also shows an ASR label so traders can know what the ASR is in terms of dollars.
Session Time Configuration:
ASR Calculation:
Visual Representation:
Give this indicator a BOOST and COMMENT your thoughts!
We hope you enjoy.
Cheers!
Not only is this indicator is useful for understanding volatility and price movement tendencies within sessions, but it also plots dynamic support and resistance levels based on the ASR.
The average session range is calculated over a specific period (default 14 sessions) by averaging the range (high - low) for each session.
Knowing what the ASR is allows the user to determine if current price action is normal or abnormal.
When a new session begins, potential support and resistance levels are calculated by breaking the ASR into quartiles which are then added and subtracted from the sessions opening price.
The indicator also shows an ASR label so traders can know what the ASR is in terms of dollars.
Session Time Configuration:
- The indicator allows users to define the session time, with default timing set from 13:00 to 22:00.
ASR Calculation:
- The ASR is calculated over a specified period (default 14 sessions) by averaging the range (high - low) of each session.
- Various levels based on the ASR are computed: 0.25 ASR, 0.5 ASR, 0.75 ASR, 1 ASR, 1.25 ASR, 1.5 ASR, 1.75 ASR, and 2 ASR.
Visual Representation:
- The indicator plots lines on the chart representing different ASR levels.
- Customize the visibility, color, width, and style (Solid, Dashed, Dotted) of these lines for better visualization.
- Labels for these lines can also be displayed, with customizable positions and text properties.
Give this indicator a BOOST and COMMENT your thoughts!
We hope you enjoy.
Cheers!
Open-source script
In true TradingView spirit, the creator of this script has made it open-source, so that traders can review and verify its functionality. Kudos to the author! While you can use it for free, remember that republishing the code is subject to our House Rules.
Get Access to the exclusive QuantVue indicators: quantvue.io/
Join thousands of traders in our Free Discord: discord.gg/tC7u7magU3
Join thousands of traders in our Free Discord: discord.gg/tC7u7magU3
Disclaimer
The information and publications are not meant to be, and do not constitute, financial, investment, trading, or other types of advice or recommendations supplied or endorsed by TradingView. Read more in the Terms of Use.