OPEN-SOURCE SCRIPT
Updated Multi-timeframe Dashboard for RSI And Stochastic RSI
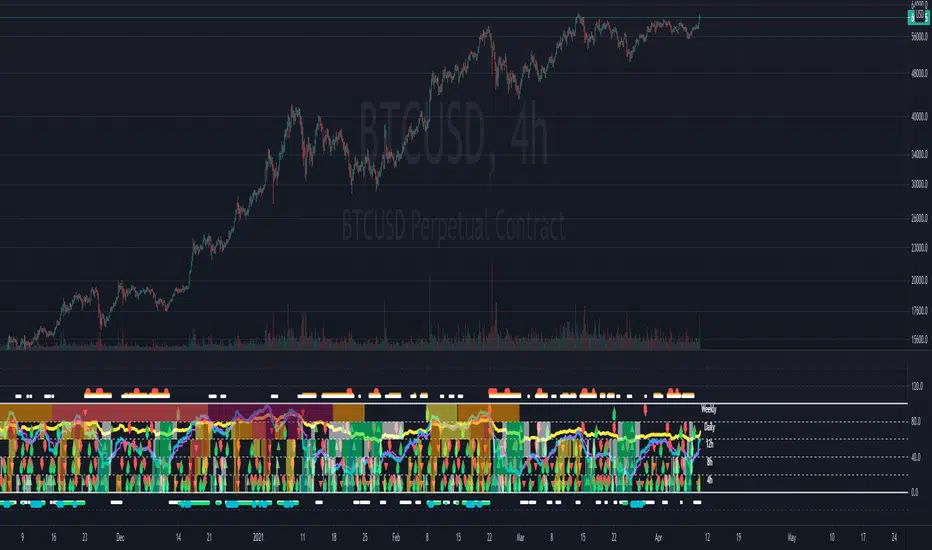
Dashboard to check multi-timeframe RSI and Stochastic RSI on 4h, 8h, 12h, D and W
Great side tool to assist on the best time to buy and sell and asset.
Shows a green arrow on a good buy moment, and a red when to sell, for all timeframes. In case there are confluence on more than one, you have the info that you need.
Uses a formula with a weight of 5 for RSI and 2 for Stochastic RSI, resulting on a factor used to set up a color for each of the timeframes.
Legend per each timeframe:
- Blue: Excellent buy, RSI and Stoch RSI are low
- Green: Great buy, RSI and Stoch RSI with a quite positive entry point
- White: Good buy
- Yellow: A possible sell, depending on combination of timeframes. Not recommended for a buy
- Orange: Good sell, depending on combination of timeframes
- Red: If on more than one timeframe, especially higher ones, it is a good time to sell
For reference (But do your own research):
- Blue on Weekly: Might represent several weeks of growth. Lower timeframes will cycle from blue to red, while daily and Weekly gradually change
- Blue on Daily: Might represent 7-15 days of growth, depending on general resistance and how strongly is the weekly
PS: Check the RSI, Stochastic RSI and other indicators directly as well
Release Notes
- Fixed some bugs related to getting info from the different timeframes- Added a weighted (weekly weight is higher) stochastic RSI and RSI with the info from the different timeframes
- When there is of trending up on multiple timeframes, shows a green dot below. When all of them are aligned, the dot is blue
- Opposite happens when going down, with orange and red dots
Open-source script
In true TradingView spirit, the creator of this script has made it open-source, so that traders can review and verify its functionality. Kudos to the author! While you can use it for free, remember that republishing the code is subject to our House Rules.
Disclaimer
The information and publications are not meant to be, and do not constitute, financial, investment, trading, or other types of advice or recommendations supplied or endorsed by TradingView. Read more in the Terms of Use.