OPEN-SOURCE SCRIPT
Math by Thomas Swing Range
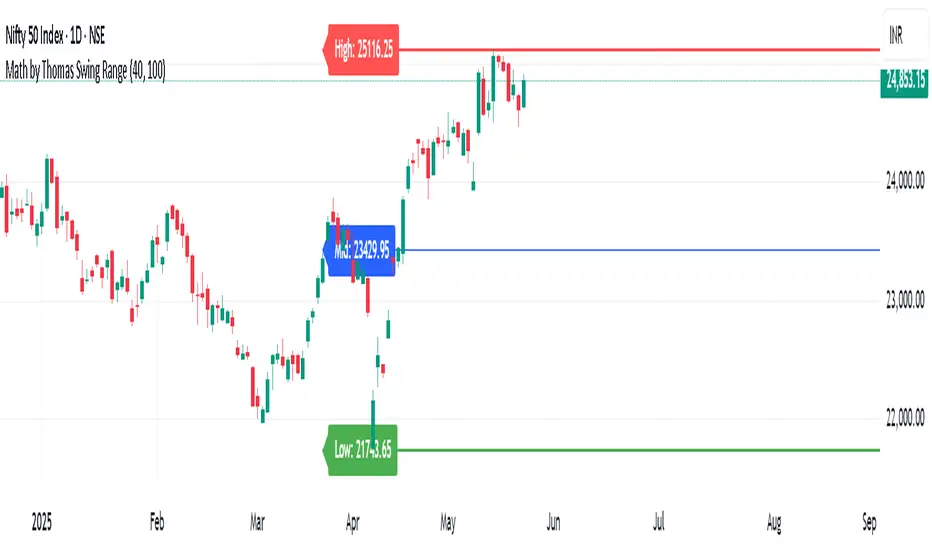
Math by Thomas Swing Range is a simple yet powerful tool designed to visually highlight key swing levels in the market based on a user-defined lookback period. It identifies the highest high, lowest low, and calculates the midpoint between them — creating a clear range for swing trading strategies.
These levels can help traders:
Spot potential support and resistance zones
Analyze price rejection near range boundaries
Frame mean-reversion or breakout setups
The indicator continuously updates and extends these lines into the future, making it easier to plan and manage trades with visual clarity.
🛠️ How to Use
Add to Chart:
Apply the indicator on any timeframe and asset (works best on higher timeframes like 1H, 4H, or Daily).
Configure Parameters:
Lookback Period: Number of candles used to detect the highest high and lowest low. Default is 20.
Extend Lines by N Bars: Number of future bars the levels should be projected to the right.
Interpret Lines:
🔴 Red Line: Swing High (Resistance)
🟢 Green Line: Swing Low (Support)
🔵 Blue Line: Midpoint (Mean level — useful for equilibrium-based strategies)
Trade Ideas:
Bounce trades from swing high/low zones.
Breakout confirmation if price closes strongly outside the range.
Reversion trades if price moves toward the midpoint after extreme moves.
Open-source script
In true TradingView spirit, the creator of this script has made it open-source, so that traders can review and verify its functionality. Kudos to the author! While you can use it for free, remember that republishing the code is subject to our House Rules.
Disclaimer
The information and publications are not meant to be, and do not constitute, financial, investment, trading, or other types of advice or recommendations supplied or endorsed by TradingView. Read more in the Terms of Use.