OPEN-SOURCE SCRIPT
Stochastic X
The "Stochastic X" script is a customizable momentum oscillator designed to help traders identify potential overbought and oversold conditions, as well as trend reversals, by analyzing the relationship between a security's closing price and its price range over a specified period. This indicator is particularly useful for traders looking to fine-tune their entry and exit points based on momentum shifts.
🔧 Indicator Settings and Customization
The script offers several user-configurable settings to tailor the indicator to specific trading strategies:
In addition to the source type, %K Period, %D Period, and Signal line periods you can now change moving average calculation for the stochastic and signal lines.
This script allows selection among various moving average methods (e.g., SMA, EMA, WMA, T3) for smoothing the %K and signal lines. Different methods can affect the responsiveness of the indicator.
🎨 Interpreting Background Colors
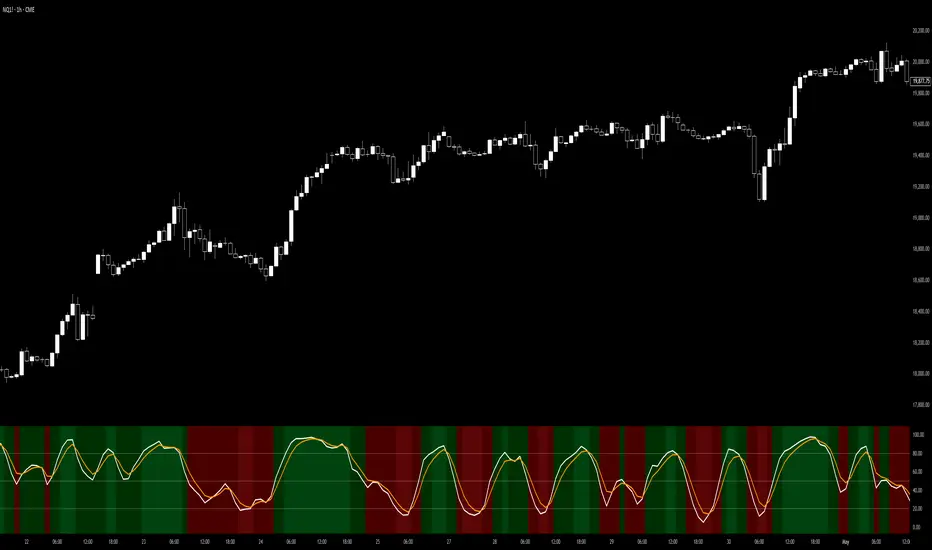
The script enhances visual analysis by changing the background color of the indicator panel based on the %K line's value:
Green Background: Indicates that the %K line is above 50, suggesting bullish momentum.
Red Background: Signifies that the %K line is below 50, pointing to bearish momentum.
Light Green Overlay: Appears when the %K line exceeds 80, highlighting overbought conditions.
Light Red Overlay: Shows up when the %K line falls below 20, indicating oversold conditions.
These visual cues assist traders in quickly assessing market momentum and potential reversal.
📈 Trading Strategies Using Stochastic X
Traders can utilize the Stochastic X indicator in various ways:
Overbought/Oversold Conditions:
A %K value above 80 may suggest that the asset is overbought, potentially signaling a price correction.
A %K value below 20 could indicate that the asset is oversold, possibly leading to a price rebound.
Signal Line Crossovers:
When the %K line crosses above the signal line, it may be interpreted as a bullish signal.
Conversely, a %K line crossing below the signal line might be seen as a bearish signal.
Divergence Analysis:
If the price makes a new high while the %K line does not, this bearish divergence could precede a price decline.
If the price hits a new low but the %K line forms a higher low, this bullish divergence might signal an upcoming price increase.
Trend Confirmation:
Sustained %K values above 50 can confirm an uptrend.
Persistent %K values below 50 may validate a downtrend.
In this chart, observe how the background colors change in response to the %K line's value, providing immediate visual feedback on market conditions. The crossovers between the %K and signal lines offer potential entry and exit points, while the overbought and oversold overlays help identify possible reversal zones.
⚙️ Adjusting Settings for Optimal Use
The Stochastic X indicator's flexibility allows traders to adjust settings to match their trading style and the specific asset's behavior:
Short-Term Trading: Use shorter periods (e.g., 5 for %K) and more responsive moving averages (e.g., WMA, VWMA, EMA, DEMA, TEMA, HMA) to capture quick market movements.
Long-Term Trading: Opt for longer periods (e.g., 14 for %K) and smoother moving averages (e.g., SMA, RMA, T3) to filter out noise and focus on broader trends.
Volatile Markets: Consider using the T3 moving average for its smoothing capabilities, helping to reduce false signals in choppy markets.
By experimenting with different settings, traders can fine-tune the indicator to better suit their analysis and improve decision-making.
🔧 Indicator Settings and Customization
The script offers several user-configurable settings to tailor the indicator to specific trading strategies:
In addition to the source type, %K Period, %D Period, and Signal line periods you can now change moving average calculation for the stochastic and signal lines.
This script allows selection among various moving average methods (e.g., SMA, EMA, WMA, T3) for smoothing the %K and signal lines. Different methods can affect the responsiveness of the indicator.
🎨 Interpreting Background Colors
The script enhances visual analysis by changing the background color of the indicator panel based on the %K line's value:
Green Background: Indicates that the %K line is above 50, suggesting bullish momentum.
Red Background: Signifies that the %K line is below 50, pointing to bearish momentum.
Light Green Overlay: Appears when the %K line exceeds 80, highlighting overbought conditions.
Light Red Overlay: Shows up when the %K line falls below 20, indicating oversold conditions.
These visual cues assist traders in quickly assessing market momentum and potential reversal.
📈 Trading Strategies Using Stochastic X
Traders can utilize the Stochastic X indicator in various ways:
Overbought/Oversold Conditions:
A %K value above 80 may suggest that the asset is overbought, potentially signaling a price correction.
A %K value below 20 could indicate that the asset is oversold, possibly leading to a price rebound.
Signal Line Crossovers:
When the %K line crosses above the signal line, it may be interpreted as a bullish signal.
Conversely, a %K line crossing below the signal line might be seen as a bearish signal.
Divergence Analysis:
If the price makes a new high while the %K line does not, this bearish divergence could precede a price decline.
If the price hits a new low but the %K line forms a higher low, this bullish divergence might signal an upcoming price increase.
Trend Confirmation:
Sustained %K values above 50 can confirm an uptrend.
Persistent %K values below 50 may validate a downtrend.
In this chart, observe how the background colors change in response to the %K line's value, providing immediate visual feedback on market conditions. The crossovers between the %K and signal lines offer potential entry and exit points, while the overbought and oversold overlays help identify possible reversal zones.
⚙️ Adjusting Settings for Optimal Use
The Stochastic X indicator's flexibility allows traders to adjust settings to match their trading style and the specific asset's behavior:
Short-Term Trading: Use shorter periods (e.g., 5 for %K) and more responsive moving averages (e.g., WMA, VWMA, EMA, DEMA, TEMA, HMA) to capture quick market movements.
Long-Term Trading: Opt for longer periods (e.g., 14 for %K) and smoother moving averages (e.g., SMA, RMA, T3) to filter out noise and focus on broader trends.
Volatile Markets: Consider using the T3 moving average for its smoothing capabilities, helping to reduce false signals in choppy markets.
By experimenting with different settings, traders can fine-tune the indicator to better suit their analysis and improve decision-making.
Open-source script
In true TradingView spirit, the creator of this script has made it open-source, so that traders can review and verify its functionality. Kudos to the author! While you can use it for free, remember that republishing the code is subject to our House Rules.
Disclaimer
The information and publications are not meant to be, and do not constitute, financial, investment, trading, or other types of advice or recommendations supplied or endorsed by TradingView. Read more in the Terms of Use.