OPEN-SOURCE SCRIPT
TDI - Traders Dynamic Index + RSI Divergences + Buy/Sell Signals
Traders Dynamic Index + RSI Divergences + Buy/Sell Signals
Credits to LazyBear (original code author) and JustUncleL (modifications)..
I added some new features:
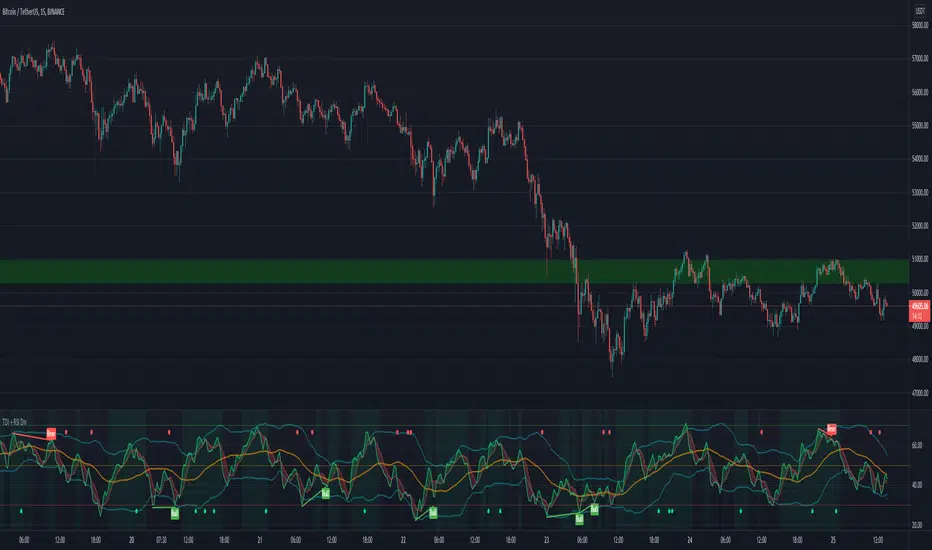
1- RSI Divergences (Original code from 'Divergence Indicator')
2- Buy/Sell Signals with alerts (Green label 'Buy' - Red label 'Sell')
3- Background colouring when RSI (Green line) crosses above MBL (yellow line)
- Buy and Sell Signals are generated using Dean Malone's method (The Author of the TDI indicator) as mentioned in his PDF: ((https://www.forexfactory.com/attachment.php/686629?attachmentid=686629&d=1303831008)), according to:
** Buy (Green Label) = RSI > 50, Red line, & Yellow line
** Sell (Red Label) = RSI < 50, Red line, & Yellow line
- I found that the best quality long trades generated when RSI crosses above red line, yellow line and they are all above 50, and vice versa for sell trades.
-I figured out another way to generate Buy/Sell Signals when RSI crosses above the yellow line, and you can stay with the trade till RSI crosses under the yellow line (I made a background colouring for that to be easily detected)
Hope you all wonderful trades..
مؤلف المؤشر هو (Dean Malone)
وكتب LazyBear كوده في tradingview
وأضاف JustUncleL بعض التعديلات عليه
أضفت إليه بعض المزايا الأخرى المتمثلة في:
1- رصد انحرافات مؤشر القوة النسبية
2- إشارات بيع وشراء بناء على طريقة مؤلف المؤشر
3- تظليل بالأخضر للمنطقة التي يعبر فيها مؤشر القوة النسبية الخط الأوسط (الخط الأصفر)
إشارات البيع والشراء تكون كالتالي:
** الشراء عندما يكون مؤشر القوة النسبية فوق الخط الأحمر وفوق خط الـ 50 وفوق الخط الأصفر
** البيع عندما يكون مؤشر القوة النسبية تحت الخط الأحمر وتحت خط الـ 50 وتحت الخط الأصفر
** أفضل إشارات الشراء حينما يعبر مؤشر القوة النسبية فوق الخط الأحمر والأصفر، ويكونوا جميعا فوق خط الـ 50، والعكس بالنسبة لإشارات البيع
يمكن استخدام المؤشر في دخول صفقات متوسط المدى، وذلك عندما يعبر مؤشر القوة النسبية فوق الخط الأصفر (قمت بتظليل المنطقة بالأخضر لسهولة رصدها) والخروج من الصفقة إذا نزل مؤشر القوة النسبية عن الخط الأصفر،
يرجى التنبه إلى أن الدخول والخروج يكون بأسباب فنية مدروسة، والمؤشر يدعم قراراتك فقط، ولا يمكن الاعتماد عليه منفردا في تحديد نقاط الدخول أوالخروج.
تجارة موفقة لكم جميعا :)
Credits to LazyBear (original code author) and JustUncleL (modifications)..
I added some new features:
1- RSI Divergences (Original code from 'Divergence Indicator')
2- Buy/Sell Signals with alerts (Green label 'Buy' - Red label 'Sell')
3- Background colouring when RSI (Green line) crosses above MBL (yellow line)
- Buy and Sell Signals are generated using Dean Malone's method (The Author of the TDI indicator) as mentioned in his PDF: ((https://www.forexfactory.com/attachment.php/686629?attachmentid=686629&d=1303831008)), according to:
** Buy (Green Label) = RSI > 50, Red line, & Yellow line
** Sell (Red Label) = RSI < 50, Red line, & Yellow line
- I found that the best quality long trades generated when RSI crosses above red line, yellow line and they are all above 50, and vice versa for sell trades.
-I figured out another way to generate Buy/Sell Signals when RSI crosses above the yellow line, and you can stay with the trade till RSI crosses under the yellow line (I made a background colouring for that to be easily detected)
Hope you all wonderful trades..
مؤلف المؤشر هو (Dean Malone)
وكتب LazyBear كوده في tradingview
وأضاف JustUncleL بعض التعديلات عليه
أضفت إليه بعض المزايا الأخرى المتمثلة في:
1- رصد انحرافات مؤشر القوة النسبية
2- إشارات بيع وشراء بناء على طريقة مؤلف المؤشر
3- تظليل بالأخضر للمنطقة التي يعبر فيها مؤشر القوة النسبية الخط الأوسط (الخط الأصفر)
إشارات البيع والشراء تكون كالتالي:
** الشراء عندما يكون مؤشر القوة النسبية فوق الخط الأحمر وفوق خط الـ 50 وفوق الخط الأصفر
** البيع عندما يكون مؤشر القوة النسبية تحت الخط الأحمر وتحت خط الـ 50 وتحت الخط الأصفر
** أفضل إشارات الشراء حينما يعبر مؤشر القوة النسبية فوق الخط الأحمر والأصفر، ويكونوا جميعا فوق خط الـ 50، والعكس بالنسبة لإشارات البيع
يمكن استخدام المؤشر في دخول صفقات متوسط المدى، وذلك عندما يعبر مؤشر القوة النسبية فوق الخط الأصفر (قمت بتظليل المنطقة بالأخضر لسهولة رصدها) والخروج من الصفقة إذا نزل مؤشر القوة النسبية عن الخط الأصفر،
يرجى التنبه إلى أن الدخول والخروج يكون بأسباب فنية مدروسة، والمؤشر يدعم قراراتك فقط، ولا يمكن الاعتماد عليه منفردا في تحديد نقاط الدخول أوالخروج.
تجارة موفقة لكم جميعا :)
Open-source script
In true TradingView spirit, the creator of this script has made it open-source, so that traders can review and verify its functionality. Kudos to the author! While you can use it for free, remember that republishing the code is subject to our House Rules.
Disclaimer
The information and publications are not meant to be, and do not constitute, financial, investment, trading, or other types of advice or recommendations supplied or endorsed by TradingView. Read more in the Terms of Use.