OPEN-SOURCE SCRIPT
RSI+Channelbands
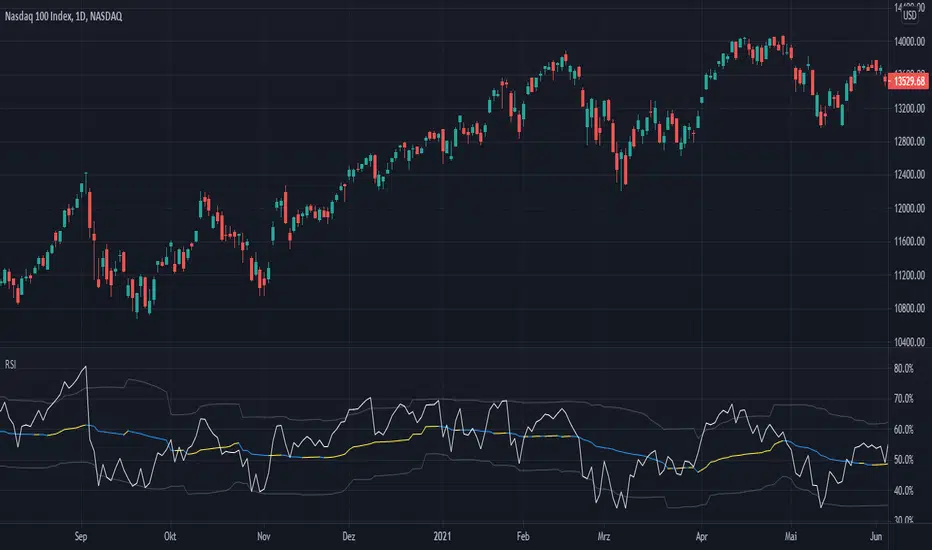
This Indicator displays a normal RSI with overbought/-sold lines which is calculated with donchian channels, pivot channel, bollinger bands and three horizontal lines.
You can averaged the channels, bands and h-lines in any combination or you can use just one of them for calculating the overbought/-sold lines.
The midline is colored in default settings in yellow for upptrending and blue for downtrending.
You can averaged the channels, bands and h-lines in any combination or you can use just one of them for calculating the overbought/-sold lines.
The midline is colored in default settings in yellow for upptrending and blue for downtrending.
Open-source script
In true TradingView spirit, the creator of this script has made it open-source, so that traders can review and verify its functionality. Kudos to the author! While you can use it for free, remember that republishing the code is subject to our House Rules.
Disclaimer
The information and publications are not meant to be, and do not constitute, financial, investment, trading, or other types of advice or recommendations supplied or endorsed by TradingView. Read more in the Terms of Use.