OPEN-SOURCE SCRIPT
Volatility Regime Classifier | ATRP Percentile Zones
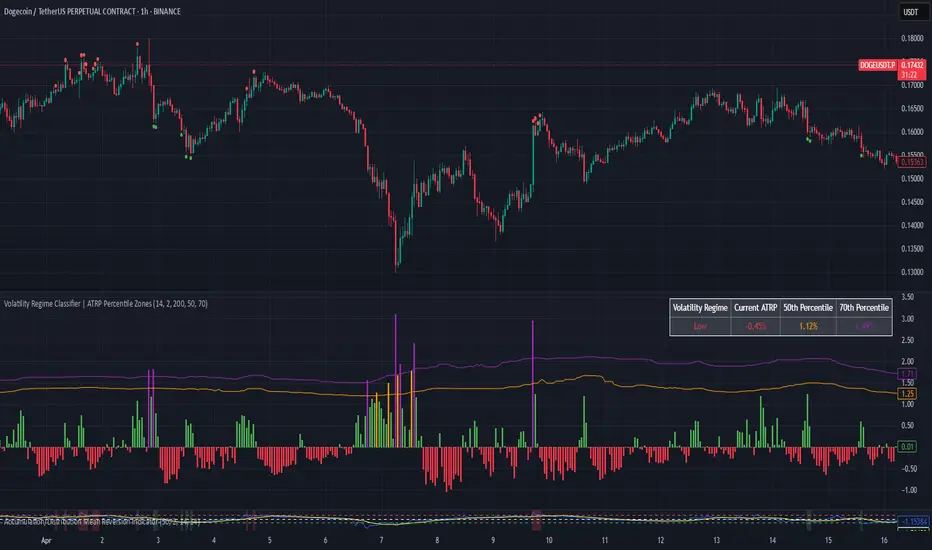
This indicator helps you understand the current volatility environment of any asset by comparing recent ATR-based values to its historical range.
It defines four regimes:
🔴 Low Volatility: Volatility is decreasing
🟢 Normal: Volatility is increasing but still below average
🟠 High: Volatility is elevated
🟣 Extreme: Volatility is very high compared to recent history
⚙️ How it works
We calculate the Average True Range (ATR) as a percentage of price (ATRP), then compare a short-term ATR to a longer-term one. Their difference shows whether volatility is picking up or slowing down.
To make the signal more adaptive, we look at the distribution of recent volatility over a rolling window. We compute the 50th and 70th percentiles of that history to set dynamic thresholds.
About distribution & percentiles
Volatility in financial markets doesn't follow a normal (Gaussian) distribution, it's often skewed, with sudden spikes and fat tails. That means fixed thresholds (like "ATR > 20") can be misleading or irrelevant across assets and timeframes.
Using percentiles solves this:
The 50th percentile marks the middle of the recent volatility range.
The 70th percentile captures a zone where volatility is unusually high, but not too rare, which keeps the signal usable and not overly sensitive.
These levels offer a balance:
⚖️ not too reactive, not too slow — just enough to highlight meaningful shifts.
✅ Use cases
Spot changes in market conditions
Filter or adapt strategies depending on the regime
Adjust position sizing and risk dynamically
Open-source script
In true TradingView spirit, the creator of this script has made it open-source, so that traders can review and verify its functionality. Kudos to the author! While you can use it for free, remember that republishing the code is subject to our House Rules.
Disclaimer
The information and publications are not meant to be, and do not constitute, financial, investment, trading, or other types of advice or recommendations supplied or endorsed by TradingView. Read more in the Terms of Use.