OPEN-SOURCE SCRIPT
Multicolor Bollinger Bands - Market Phases
Hi everyone
Hope you're all doing well 😘
Today I feel gracious and decided to give to the community. And giving not only an indicator but also a trading method
This trading method shows how a convergence based on moving averages is tremendous
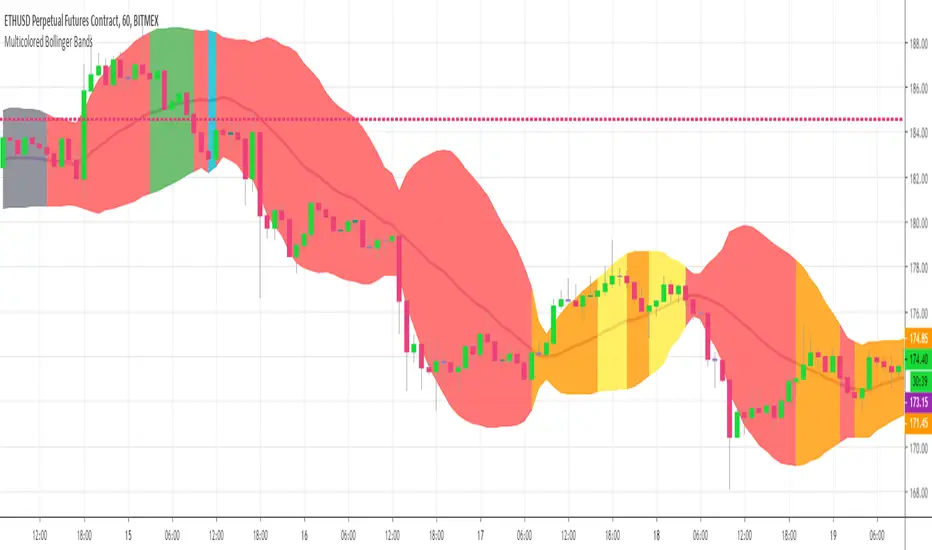
Multicolour Bollinger Bands indicator that indicates market phases.
It plots on the price chart, thanks to different color zones between the bands, a breakdown of the different phases that the price operates during a trend.
The different zones are identified as follows:
- red color zone: trend is bearish, price is below the 200 periods moving average
- orange color zone: price operate a technical rebound below the 200 periods moving average
- yellow color zone: (phase 1 which indicate a new bearish cycle)
- light green zone: (phase 2 which indicate a new bullish cycle)
- dark green zone: trend is bullish, price is above the 200 periods moving average
- grey color zone: calm phase of price
- dark blue color zone: price is consolidating in either bullish or bearish trend
- light blue zones: price will revert to a new opposite trend (either long or short new trend)
By identifying clearly the different market phases with the multicolor Bollinger bands, the market entries by either a the beginning of a new trend or just after a rebound or a consolidating phase is easier to spot on.
Trade well and trade safe
Dave
Hope you're all doing well 😘
Today I feel gracious and decided to give to the community. And giving not only an indicator but also a trading method
This trading method shows how a convergence based on moving averages is tremendous
Multicolour Bollinger Bands indicator that indicates market phases.
It plots on the price chart, thanks to different color zones between the bands, a breakdown of the different phases that the price operates during a trend.
The different zones are identified as follows:
- red color zone: trend is bearish, price is below the 200 periods moving average
- orange color zone: price operate a technical rebound below the 200 periods moving average
- yellow color zone: (phase 1 which indicate a new bearish cycle)
- light green zone: (phase 2 which indicate a new bullish cycle)
- dark green zone: trend is bullish, price is above the 200 periods moving average
- grey color zone: calm phase of price
- dark blue color zone: price is consolidating in either bullish or bearish trend
- light blue zones: price will revert to a new opposite trend (either long or short new trend)
By identifying clearly the different market phases with the multicolor Bollinger bands, the market entries by either a the beginning of a new trend or just after a rebound or a consolidating phase is easier to spot on.
Trade well and trade safe
Dave
Open-source script
In true TradingView spirit, the creator of this script has made it open-source, so that traders can review and verify its functionality. Kudos to the author! While you can use it for free, remember that republishing the code is subject to our House Rules.
⭐️ Listed as an Official TradingView Trusted TOP Pine Programmer
📧 Coding/Consulting Inquiries: dave@best-trading-indicator
Telegram: Daveatt
⏩ Course: best-trading-indicator.com
Twitter: twitter.com/bti_trading
📧 Coding/Consulting Inquiries: dave@best-trading-indicator
Telegram: Daveatt
⏩ Course: best-trading-indicator.com
Twitter: twitter.com/bti_trading
Disclaimer
The information and publications are not meant to be, and do not constitute, financial, investment, trading, or other types of advice or recommendations supplied or endorsed by TradingView. Read more in the Terms of Use.