OPEN-SOURCE SCRIPT
Bull vs Bear Volume on Price Chart
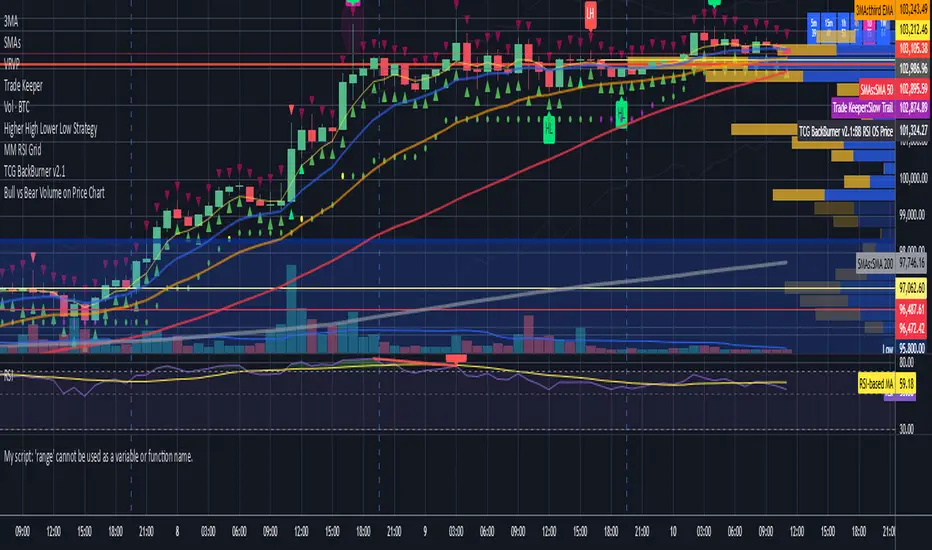
This script overlays estimated bullish and bearish volume directly on the price chart, making it easy to spot buying vs. selling pressure without switching to a separate volume pane.
🔍 Features:
📈 Bullish volume markers appear as green triangles below the candle.
📉 Bearish volume markers appear as red triangles above the candle.
🔄 Optional smoothing to reduce noise using simple moving average (SMA).
⚠️ Volume spike highlights: Bullish spikes turn lime green, bearish spikes turn bright red.
🔢 Toggle labels to see estimated volume values above/below each candle.
🔄 Works on all timeframes, from intraday to weekly/monthly charts.
📐 Methodology:
Bullish and bearish volume are estimated using the candle's range:
More bullish volume when the close is near the high.
More bearish volume when the close is near the low.
This is a visual proxy, not true order flow data.
Open-source script
In true TradingView spirit, the creator of this script has made it open-source, so that traders can review and verify its functionality. Kudos to the author! While you can use it for free, remember that republishing the code is subject to our House Rules.
Disclaimer
The information and publications are not meant to be, and do not constitute, financial, investment, trading, or other types of advice or recommendations supplied or endorsed by TradingView. Read more in the Terms of Use.