OPEN-SOURCE SCRIPT
Updated 5m Candle Overlay
Description:
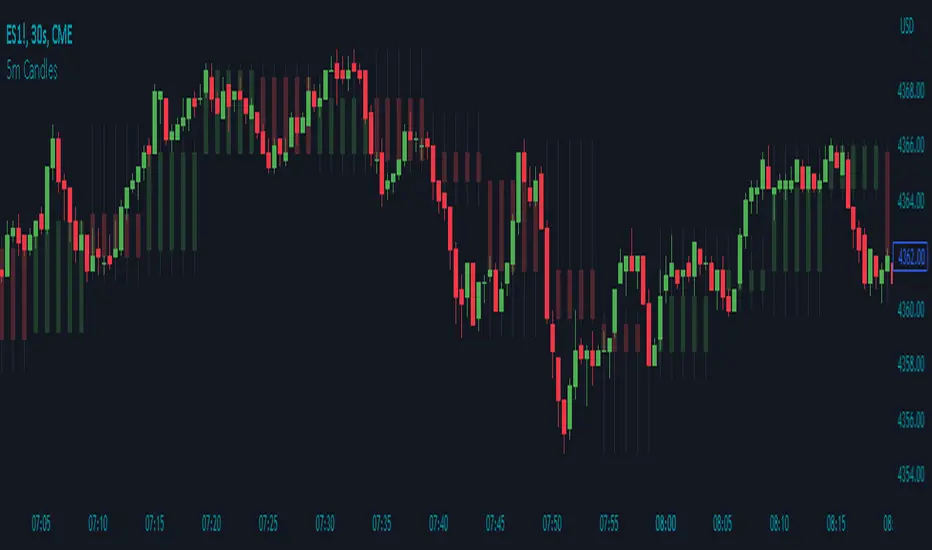
The 5m Candle Overlay indicator is a powerful technical analysis tool designed to overlay 5-minute candles onto your chart. This indicator enables detailed analysis of price action within the 5-minute time frame, providing valuable insights into short-term market movements.
How it Works:
The 5m Candle Overlay indicator calculates the OHLC (Open, High, Low, Close) values specifically for the 5-minute time frame. By utilizing the request.security function, it retrieves the OHLC values for each 5-minute candle. The indicator then determines the color for each candle based on a comparison between the close and open prices. Bullish candles are assigned a green color with 75% opacity, while bearish candles are assigned a red color with 75% opacity. Additionally, the indicator checks if the current bar index is a multiple of 5 to prevent overlapping and enhance visualization.
Usage:
To effectively utilize the 5m Candle Overlay indicator, follow these steps:
1. Apply the 5m Candle Overlay indicator to your chart by adding it from the available indicators.
2. Observe the overlay of 5-minute candles on your chart, providing a detailed representation of price movements within the 5-minute time frame.
3. Interpret the candles:
- Bullish candles (green by default) indicate that the close price is higher than the open price, suggesting potential buying pressure.
- Bearish candles (red by default) indicate that the close price is lower than the open price, suggesting potential selling pressure.
4. Note that the indicator plots candles with a vertical offset every fifth indicator to prevent overlapping, ensuring clarity and ease of interpretation.
5. Combine the analysis of the 5-minute candles with other technical analysis tools, such as support and resistance levels, trend lines, or indicators from different time frames, to gain deeper insights and identify potential trade setups.
6. Implement appropriate risk management strategies, including setting stop-loss orders and position sizing, to effectively manage your trades within the 5-minute time frame and protect your capital.
Release Notes
Update to indicator image.Release Notes
Updates to the color settingsOpen-source script
In true TradingView spirit, the creator of this script has made it open-source, so that traders can review and verify its functionality. Kudos to the author! While you can use it for free, remember that republishing the code is subject to our House Rules.
Disclaimer
The information and publications are not meant to be, and do not constitute, financial, investment, trading, or other types of advice or recommendations supplied or endorsed by TradingView. Read more in the Terms of Use.
Open-source script
In true TradingView spirit, the creator of this script has made it open-source, so that traders can review and verify its functionality. Kudos to the author! While you can use it for free, remember that republishing the code is subject to our House Rules.
Disclaimer
The information and publications are not meant to be, and do not constitute, financial, investment, trading, or other types of advice or recommendations supplied or endorsed by TradingView. Read more in the Terms of Use.