OPEN-SOURCE SCRIPT
Updated Moving Average Ribbon
Moving Average Ribbon:
-----------------------------------------------------------
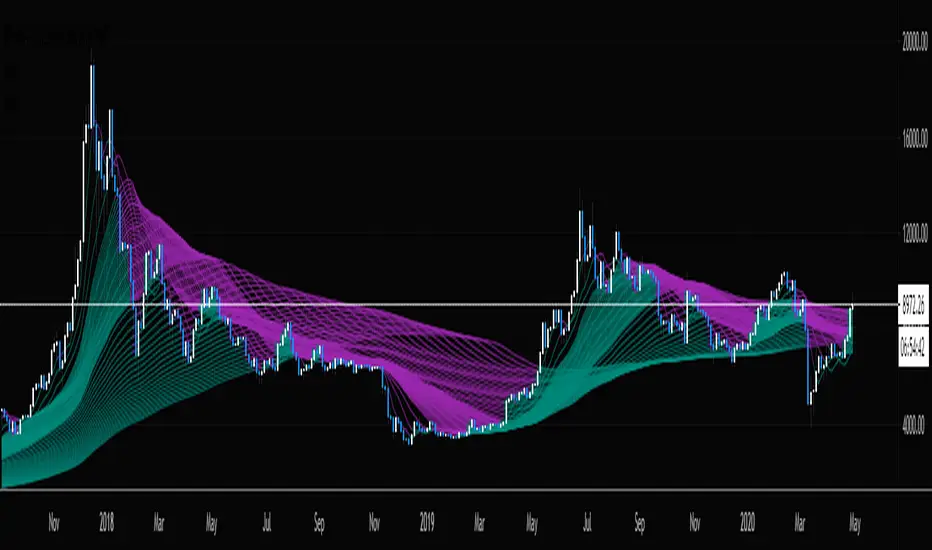
A series of moving averages of different lengths to create a ribbon-like indicator. Traders can determine trend strength by the distance between the moving averages, the overall balance of the coloured lines and determine price points. Price movements through the ribbon can be used to identify trend changes.
SMA, EMA, WMA with user defined length, starting plot, number of plots to show, theme choice and colour calculation toggle.
Inputs:
-----------------------------------------------------------
Source: input value for MAs (close)
Type: moving average type (ema)
Theme: multiple colours/themes (theme 2)
Length: MA length (13)
Start: MA plot number to start ribbon on (1)
No. of MAs: number of plots to show; maximum 32 (32)
Colour option: unchecked then line colour is based on the source value crossing current MA otherwise the moving average below (false)
Example:
-----------------------------------------------------------
multiple MAs overlaid with different values give interesting results e.g.
Ribbon1 :
length: 13
start: 1
Ribbon2:
length:1
start: 26
Notes:
-----------------------------------------------------------
if increasing the length beyond around 150 results in "references too many candles in history" error then reduce the no. of MAs value to show less MA plots; the longer length MAs will go beyond the 5k max candle history..
-----------------------------------------------------------
A series of moving averages of different lengths to create a ribbon-like indicator. Traders can determine trend strength by the distance between the moving averages, the overall balance of the coloured lines and determine price points. Price movements through the ribbon can be used to identify trend changes.
SMA, EMA, WMA with user defined length, starting plot, number of plots to show, theme choice and colour calculation toggle.
Inputs:
-----------------------------------------------------------
Source: input value for MAs (close)
Type: moving average type (ema)
Theme: multiple colours/themes (theme 2)
Length: MA length (13)
Start: MA plot number to start ribbon on (1)
No. of MAs: number of plots to show; maximum 32 (32)
Colour option: unchecked then line colour is based on the source value crossing current MA otherwise the moving average below (false)
Example:
-----------------------------------------------------------
multiple MAs overlaid with different values give interesting results e.g.
Ribbon1 :
length: 13
start: 1
Ribbon2:
length:1
start: 26
Notes:
-----------------------------------------------------------
if increasing the length beyond around 150 results in "references too many candles in history" error then reduce the no. of MAs value to show less MA plots; the longer length MAs will go beyond the 5k max candle history..
Release Notes
Updated legacy code.Release Notes
Updated legacy code.Release Notes
Updated legacy code.Release Notes
Updated defaults.Open-source script
In true TradingView spirit, the creator of this script has made it open-source, so that traders can review and verify its functionality. Kudos to the author! While you can use it for free, remember that republishing the code is subject to our House Rules.
Disclaimer
The information and publications are not meant to be, and do not constitute, financial, investment, trading, or other types of advice or recommendations supplied or endorsed by TradingView. Read more in the Terms of Use.
Open-source script
In true TradingView spirit, the creator of this script has made it open-source, so that traders can review and verify its functionality. Kudos to the author! While you can use it for free, remember that republishing the code is subject to our House Rules.
Disclaimer
The information and publications are not meant to be, and do not constitute, financial, investment, trading, or other types of advice or recommendations supplied or endorsed by TradingView. Read more in the Terms of Use.