OPEN-SOURCE SCRIPT
Updated ORB Range Indicator with Fibonacci Targets
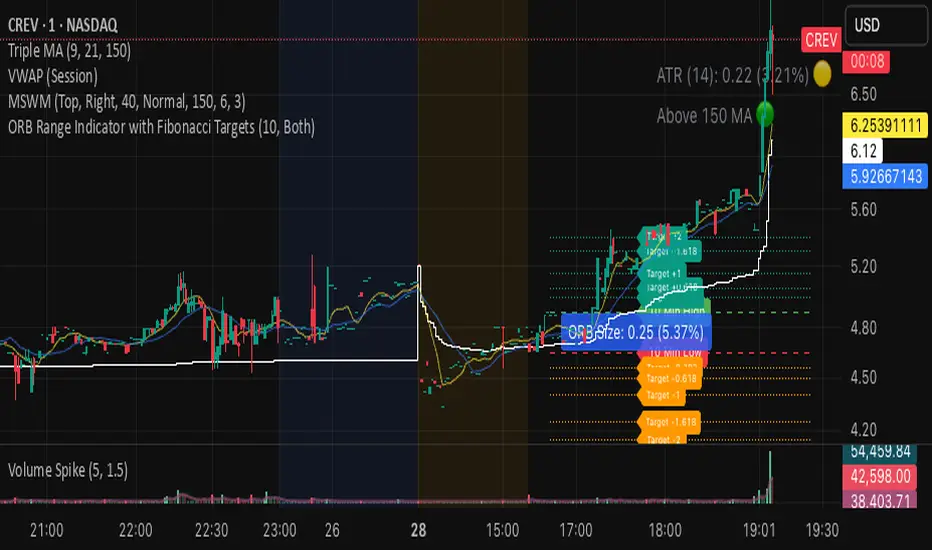
This script plots the Opening Range (ORB) high and low based on a configurable time window (5–45 minutes from the U.S. session open at 9:30 AM EST).
Once the ORB window closes, the indicator draws horizontal lines marking:
ORB High and Low
The size of the range in price and %
Fibonacci-based price targets above and below the range (0.382, 0.618, 1.000, 1.618, 2.000)
You can control:
Which Fibonacci levels to display
Whether to show long targets, short targets, or both
All drawings are automatically cleared at the start of each trading day.
Ideal for breakout traders using ORB and Fibonacci extensions for target planning.
Release Notes
ORB Range Indicator with Fibonacci Targets
This script plots the Opening Range (ORB) high and low based on a configurable time window (5–45 minutes from the U.S. session open at 9:30 AM EST).
Once the ORB window closes, the indicator draws horizontal lines marking:
ORB High and Low
The size of the range in price and %
Fibonacci-based price targets above and below the range (0.382, 0.618, 1.000, 1.618, 2.000)
You can control:
Which Fibonacci levels to display
Whether to show long targets, short targets, or both
All drawings are automatically cleared at the start of each trading day.
Ideal for breakout traders using ORB and Fibonacci extensions for target planning.
Release Notes
A recent fix was added to improve stability — it ensures that the indicator works correctly even on low-volume or quiet days by safely handling situations where no breakout lines or labels are drawn. This prevents potential runtime errors that occurred in some edge cases.If you run into any issues or bugs, feel free to leave a comment and I’ll take a look.
Open-source script
In true TradingView spirit, the creator of this script has made it open-source, so that traders can review and verify its functionality. Kudos to the author! While you can use it for free, remember that republishing the code is subject to our House Rules.
Disclaimer
The information and publications are not meant to be, and do not constitute, financial, investment, trading, or other types of advice or recommendations supplied or endorsed by TradingView. Read more in the Terms of Use.