OPEN-SOURCE SCRIPT
Performance Comparator
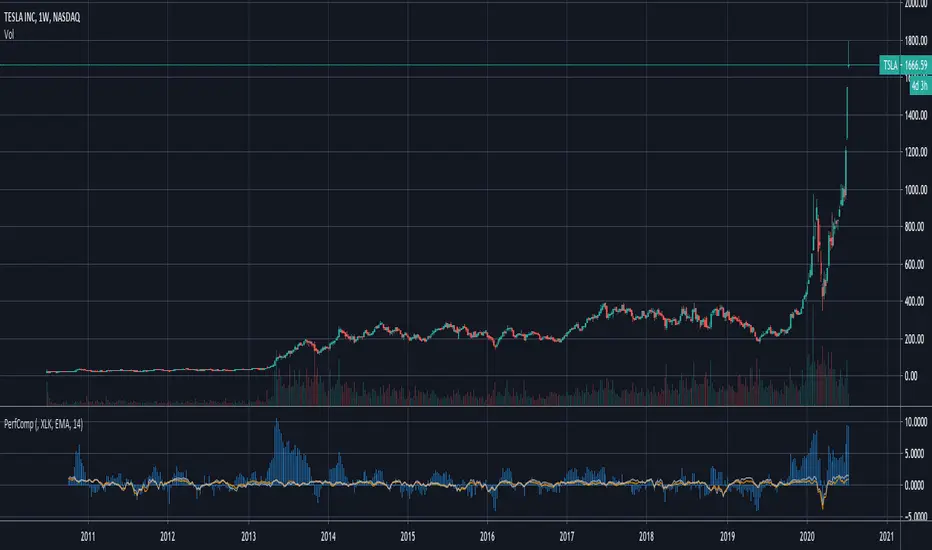
This indicator allows to compare the performance (% change) of a given symbol with the larger market ( SPY) and/or with a custom symbol, which defaults to
  XLK (an ETF tracking technology companies from the S&P 500).
The performance for the current symbol is displayed as a blue histogram, while performance for theSPY and the custom symbol are respectively displayed as orange and white lines, making it easy to spot when the symbol outperformed the market.
Features:
The performance for the current symbol is displayed as a blue histogram, while performance for the
Features:
- Configurable time resolution (default: same as chart)
- Comparison using change percentage or its EMA/WMA/SMA (default: EMA)
- Configurable moving average length
- Optionally hide SPY or the custom symbol from the chart
Open-source script
In true TradingView spirit, the creator of this script has made it open-source, so that traders can review and verify its functionality. Kudos to the author! While you can use it for free, remember that republishing the code is subject to our House Rules.
Disclaimer
The information and publications are not meant to be, and do not constitute, financial, investment, trading, or other types of advice or recommendations supplied or endorsed by TradingView. Read more in the Terms of Use.