OPEN-SOURCE SCRIPT
Bollinger and Tendencies (Bollinger e Tendências )
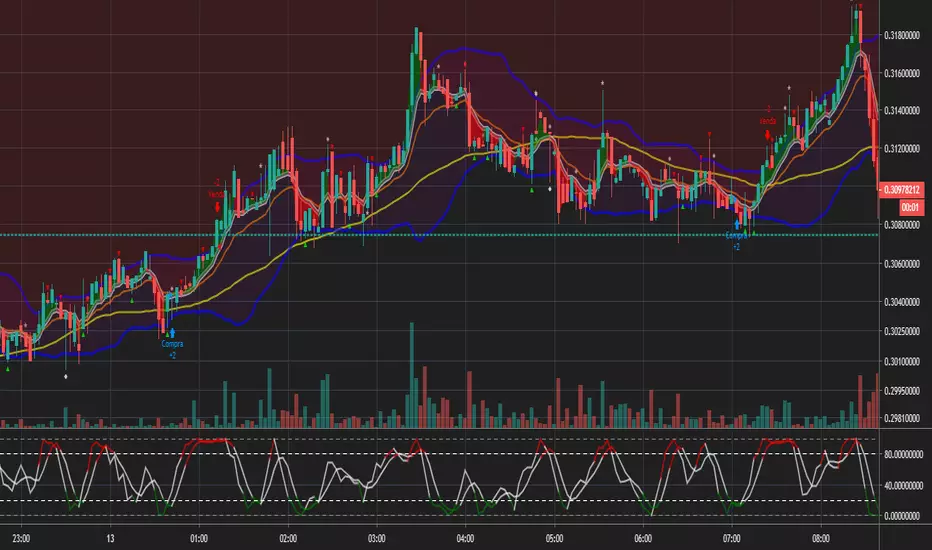
The strategy consists of buying when the price breaks up (crossover) the bottom line of the Bollinger and selling when the price breaks down (crossunder) to your top line.
The chart still shows trends clearly, with the fill between the exponential average and the closing value of the canlestick, green at high, red at low (this part of the script is based on the code: "Pivot Daily Price Color" by Rimko).
It also places notes on the high and low candlesticks (based on the code: "Candlesticks Pattern Identified" by Repo32).
It is recommended to use it in conjunction with the "IFR and Storage" script (also available to me), and some volume script.
A estratégia consiste em comprar quando o preço rompe para cima (crossover) a linha inferior do Bollinger e vender quando o preço rompe para baixo (crossunder) a sua linha superior.
O gráfico ainda mostra as tendências de forma clara, com o preenchimento entre a média exponencial e o valor de fechamento do canlestick, verde em alta, vermelho em baixa (essa parte do script é baseada no código: "Pivot Daily Price Color" do usuário: Rimko).
Também, coloca apontamentos nos candlesticks de alta e de baixa (baseado no código: "Candlesticks Pattern Identified" do usuário Repo32).
Recomenda-se a utilização em conjunto com o script "IFR e Estocagem" (também por mim disponibilizado), e algum script de volume.
Open-source script
In true TradingView spirit, the creator of this script has made it open-source, so that traders can review and verify its functionality. Kudos to the author! While you can use it for free, remember that republishing the code is subject to our House Rules.
Disclaimer
The information and publications are not meant to be, and do not constitute, financial, investment, trading, or other types of advice or recommendations supplied or endorsed by TradingView. Read more in the Terms of Use.