OPEN-SOURCE SCRIPT
Updated ATR Grid Levels [By MUQWISHI]
▋ INTRODUCTION :
The “ATR Levels” produces a sequence of horizontal line levels above and below the Center Line (reference level). They are sized based on the instrument's volatility, representing the average historical price movement on a selected higher timeframe using the average true range (ATR) indicator.
_______________________
▋ OVERVIEW:

_______________________
▋ IMPLEMENTATION:
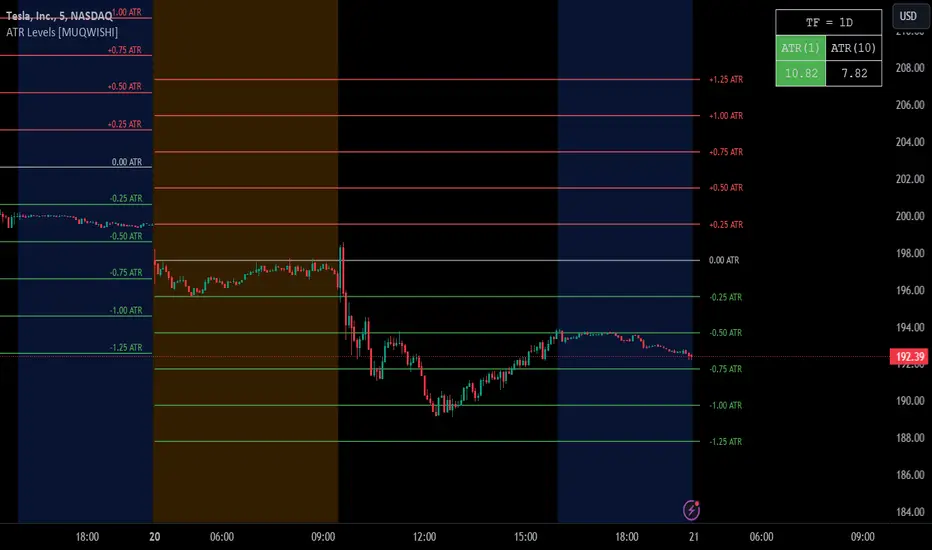
The indicator starts by drawing a Center Line that is selected by the user from a variety of common levels. Then, it draws a sequence of horizontal lines above and below the Center Line, which are sized based on the most confirmed average true range (ATR) at the selected higher timeframe.
In the top right corner of the chart, there is a table displaying both the selected ATR (in the right cell) and the ATR of the current bar (in the left cell). This feature enables users to compare these two values. It's important to note that the ATR of the current bar may not be confirmed yet, as the market is still active.

_______________________
▋ INDICATOR SETTINGS:
# Section (1): ATR Settings

(1) ATR Period & Smoothing.
(2) Timeframe where ATR value imported from.
(3) To show/hide the table comparison between the current ATR and the ATR for the selected period. Also, ability to color the current ATR cell if it’s greater.
# Section (2): Levels Settings

(1) Selecting a Center Line level among a variety of common levels, which is taken as reference level where a sequence of horizontal lines plot above and below it.
(2) Size of grid in ATR unit.
(3) Number of horizontal lines to plot in a single side.
(4) Grid Side. Ability to plot above or below the Center Line.
(5) Lines colors, and mode.
(6) Line style.
(7) Label style.
(8) Ability to remove old lines, from previous HTF.
_____________________
▋ COMMENT:
The ATR Levels should not be taken as a major concept to build a trading decision.
Please let me know if you have any questions.
Thank you.
The “ATR Levels” produces a sequence of horizontal line levels above and below the Center Line (reference level). They are sized based on the instrument's volatility, representing the average historical price movement on a selected higher timeframe using the average true range (ATR) indicator.
_______________________
▋ OVERVIEW:
_______________________
▋ IMPLEMENTATION:
The indicator starts by drawing a Center Line that is selected by the user from a variety of common levels. Then, it draws a sequence of horizontal lines above and below the Center Line, which are sized based on the most confirmed average true range (ATR) at the selected higher timeframe.
In the top right corner of the chart, there is a table displaying both the selected ATR (in the right cell) and the ATR of the current bar (in the left cell). This feature enables users to compare these two values. It's important to note that the ATR of the current bar may not be confirmed yet, as the market is still active.
_______________________
▋ INDICATOR SETTINGS:
# Section (1): ATR Settings
(1) ATR Period & Smoothing.
(2) Timeframe where ATR value imported from.
(3) To show/hide the table comparison between the current ATR and the ATR for the selected period. Also, ability to color the current ATR cell if it’s greater.
# Section (2): Levels Settings
(1) Selecting a Center Line level among a variety of common levels, which is taken as reference level where a sequence of horizontal lines plot above and below it.
(2) Size of grid in ATR unit.
(3) Number of horizontal lines to plot in a single side.
(4) Grid Side. Ability to plot above or below the Center Line.
(5) Lines colors, and mode.
(6) Line style.
(7) Label style.
(8) Ability to remove old lines, from previous HTF.
_____________________
▋ COMMENT:
The ATR Levels should not be taken as a major concept to build a trading decision.
Please let me know if you have any questions.
Thank you.
Release Notes
Updates:1. Timeframe string format.
2. Removed HMA; it's not compatible with the study.
Open-source script
In true TradingView spirit, the creator of this script has made it open-source, so that traders can review and verify its functionality. Kudos to the author! While you can use it for free, remember that republishing the code is subject to our House Rules.
Trusted Pine Programmer, For Coding Inquiries
► Website muqwishi.com/home/quotation/
► Telegram t.me/MUQWISHI
► Email service@muqwishi.com
⛾ Support My Work on “Buy Me a Coffee” buymeacoffee.com/muqwishi
► Website muqwishi.com/home/quotation/
► Telegram t.me/MUQWISHI
► Email service@muqwishi.com
⛾ Support My Work on “Buy Me a Coffee” buymeacoffee.com/muqwishi
Disclaimer
The information and publications are not meant to be, and do not constitute, financial, investment, trading, or other types of advice or recommendations supplied or endorsed by TradingView. Read more in the Terms of Use.