OPEN-SOURCE SCRIPT
SExI - Super Exhaustion Indicator [Da_Prof]
As we know, the RSI can remain at "overbought" or "oversold" levels for long periods of time while the price continues in that direction. The SExI (Super Exhaustion Indicator) is an indicator designed to help detect exhaustion of strong moves.
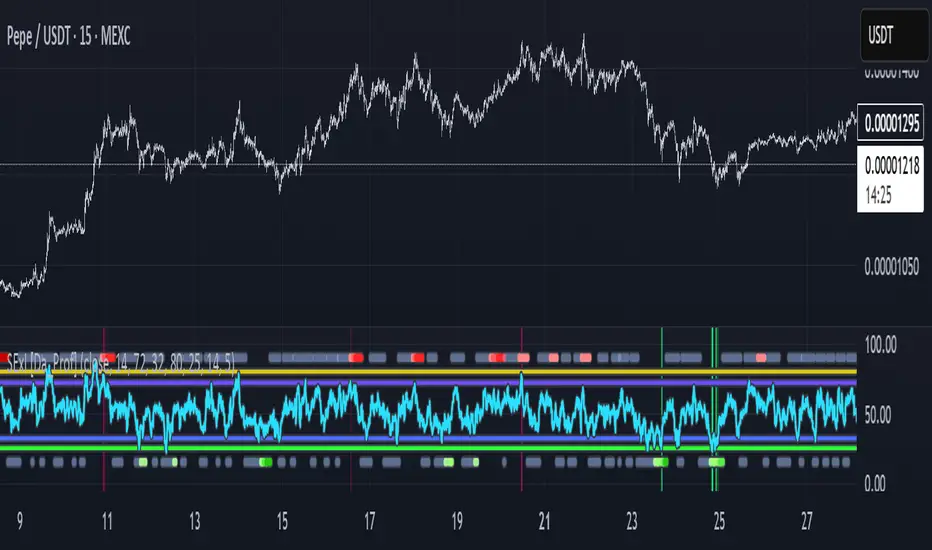
The SExI is a combination of the RSI and "upper" Aroon. For the indicator to trigger, the RSI has to be above or below a top/bottom trigger line when the Aroon has had a set number of drives up or down correspondingly. An Aroon top drive is defined as the Aroon hitting 100% on the current candle when the previous candle was below 100%. An Aroon bottom drive is defined as the Aroon hitting 0% on the current candle when the previous candle was above 0%. Consecutive top or bottom drives are counted and exhaustion triggers when these drives hit a setpoint (default is 5 drives = the Aroon exhaustion trigger). When Aroon exhaustion is triggered and the RSI is correspondingly above/below a trigger line, the overall indicator signals exhaustion.
The Aroon drives are visualized at the top and bottom of the indicator. The RSI is plotted as a line that crosses top and bottom trigger lines. There are extreme trigger values for both the bottom and top exhaustion triggers.
This indicator can be used with any asset on any timeframe. It nicely pairs with the Super Strength Indicator (invite-only).
Open-source script
In true TradingView spirit, the creator of this script has made it open-source, so that traders can review and verify its functionality. Kudos to the author! While you can use it for free, remember that republishing the code is subject to our House Rules.
Disclaimer
The information and publications are not meant to be, and do not constitute, financial, investment, trading, or other types of advice or recommendations supplied or endorsed by TradingView. Read more in the Terms of Use.