OPEN-SOURCE SCRIPT
Updated All Lines
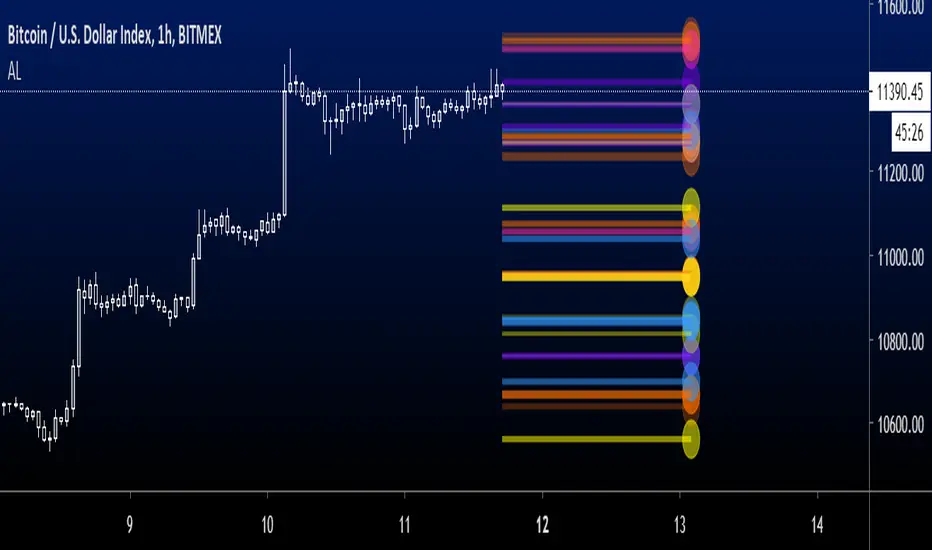
The objective of this script is to try to display as many overlay indicators as possible simultaneously while keeping the clutter to a minimum.
--Included are Indicators are--
sma 20 50 100 200
ema 20 50 100 200
High/Low
Bollinger bands upper/lower
Pivot points PP R1 R2 R3 S1 S2 S3
-- For Time periods --
Hour,Day,Week
--- How To Use --
Switch it on when looking for likely support or resistance areas to plot your trade.
The more lines that overlay each other indicate even greater support/resistance at that point
meaning if the price is going down it may bounce up at this area or if the price is going up it may bounce down.
Also the more visible the line the more strength it has to effect the price. This value can be edited in settings by adjusting the power value for each indicator as it can often depend on what you are trading.
--Tips--
If you want to know what the line represents hover your cursor over the dot at the end of the line and a tool tip will appear.
If there are to many circles zoom in the price more to separate them and try to hover again.
Release Notes
Updated screen shot to remove irrelevant indicators. Release Notes
Optional display of one hour bollinger bands and ema lines.Each line color can now be changed in options.
Lines length is now consistent across all time frames.
Lines can be offset from the current time into the future.
General bug fixes.
Release Notes
ScreenshotOpen-source script
In true TradingView spirit, the creator of this script has made it open-source, so that traders can review and verify its functionality. Kudos to the author! While you can use it for free, remember that republishing the code is subject to our House Rules.
Disclaimer
The information and publications are not meant to be, and do not constitute, financial, investment, trading, or other types of advice or recommendations supplied or endorsed by TradingView. Read more in the Terms of Use.
Open-source script
In true TradingView spirit, the creator of this script has made it open-source, so that traders can review and verify its functionality. Kudos to the author! While you can use it for free, remember that republishing the code is subject to our House Rules.
Disclaimer
The information and publications are not meant to be, and do not constitute, financial, investment, trading, or other types of advice or recommendations supplied or endorsed by TradingView. Read more in the Terms of Use.