OPEN-SOURCE SCRIPT
Updated RSI Trigger Count (30 Days) - Both Sides
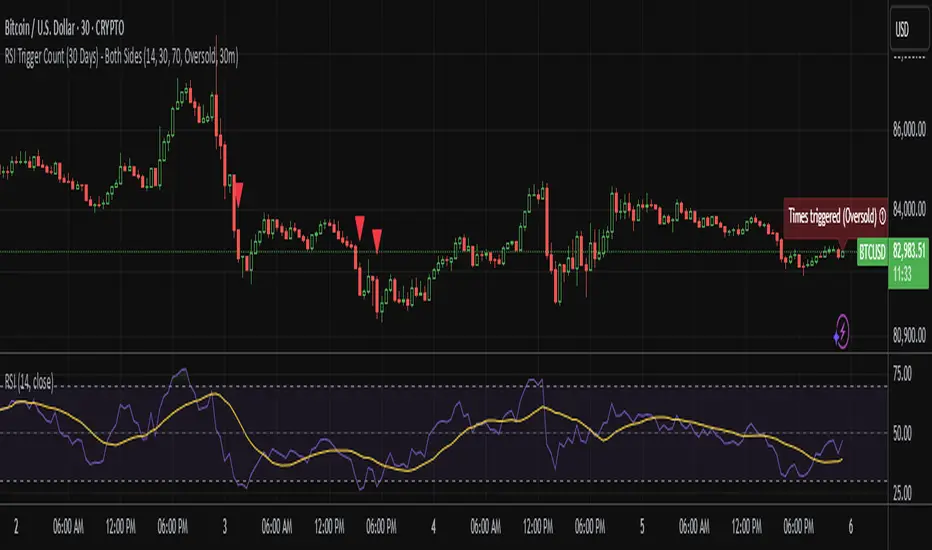
RSI Dual Trigger Counter (30 Days)
This indicator tracks both oversold (crossunder) and overbought (crossover) RSI events on a 30-minute chart, featuring:
Dual-Mode Selector:
Counts either RSI < 30 (oversold) or RSI > 70 (overbought) crossings
Toggle between modes via input menu
30-Day Rolling Count:
Displays total triggers in the last 30 days (e.g., "Times triggered (Oversold) ① 19")
Visual Alerts:
Red triangles ↓ for oversold crossunders
Green triangles ↑ for overbought crossovers
Customizable:
Adjustable RSI length (2-100) and thresholds (1-100)
Works on any timeframe (auto-scales calculations)
Purpose: Identifies frequent reversal signals for both buying dips (oversold) and selling rallies (overbought).
Release Notes
Features:Tracks both oversold (RSI < 30) and overbought (RSI > 70) signals with a toggle.
30-day rolling count resets automatically.
Visual alerts (▼ red for oversold, ▲ green for overbought).
Works on all timeframes (1m to 1D+).
Use Cases:
Spot mean-reversion opportunities.
Confirm overextended price movements.
Inputs:
Adjustable RSI length, thresholds, and condition type (oversold/overbought).
Open-source script
In true TradingView spirit, the creator of this script has made it open-source, so that traders can review and verify its functionality. Kudos to the author! While you can use it for free, remember that republishing the code is subject to our House Rules.
Disclaimer
The information and publications are not meant to be, and do not constitute, financial, investment, trading, or other types of advice or recommendations supplied or endorsed by TradingView. Read more in the Terms of Use.