OPEN-SOURCE SCRIPT
Smart Money Range [ChartPrime]
The Smart Money Range indicator is designed to provide traders with a holistic view of market structure, emphasizing potential key support and resistance levels within a predefined range. This indicator is not just a visually pleasing, but also a comprehensive guide to understanding the market’s dynamics at a given level.

Key Features:
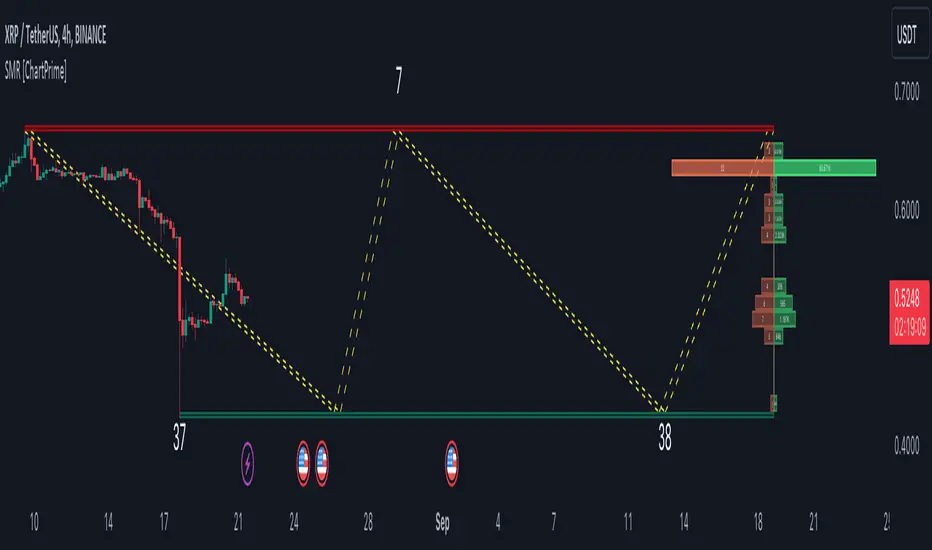
Defined Range: The indicator demarcates a clear range, highlighting support and resistance levels within it. This aids in identifying potential areas of buying and selling pressure. These are derived from highly significant areas that have been touched many times before.
Touches Counter: Underneath the support and resistance lines, there are numerical values that show the number of times price has interacted with these levels. This can provide insights into the strength or weakness of a particular level.
Zig-Zag Projections: Within the range, there's a zig-zag pattern indicating possible future touches, helping traders anticipate future price movements.
Double-Sided Profile: To the right of the range, a dual-profile is showcased. One side of the profile displays the volume traded at specific price levels, giving insights into where significant buying or selling has occurred. On the other side, it reflects the number of touches at that given price level, reinforcing the importance of particular price points.
Customizability: Users have the option to adjust the period setting, allowing them to cater the indicator to their specific trading style and configuration. Additionally, with volume levels settings, traders can adjust the number of bins in the profile for a tailored view.
Key Features:
Defined Range: The indicator demarcates a clear range, highlighting support and resistance levels within it. This aids in identifying potential areas of buying and selling pressure. These are derived from highly significant areas that have been touched many times before.
Touches Counter: Underneath the support and resistance lines, there are numerical values that show the number of times price has interacted with these levels. This can provide insights into the strength or weakness of a particular level.
Zig-Zag Projections: Within the range, there's a zig-zag pattern indicating possible future touches, helping traders anticipate future price movements.
Double-Sided Profile: To the right of the range, a dual-profile is showcased. One side of the profile displays the volume traded at specific price levels, giving insights into where significant buying or selling has occurred. On the other side, it reflects the number of touches at that given price level, reinforcing the importance of particular price points.
Customizability: Users have the option to adjust the period setting, allowing them to cater the indicator to their specific trading style and configuration. Additionally, with volume levels settings, traders can adjust the number of bins in the profile for a tailored view.
Open-source script
In true TradingView spirit, the creator of this script has made it open-source, so that traders can review and verify its functionality. Kudos to the author! While you can use it for free, remember that republishing the code is subject to our House Rules.
Disclaimer
The information and publications are not meant to be, and do not constitute, financial, investment, trading, or other types of advice or recommendations supplied or endorsed by TradingView. Read more in the Terms of Use.