OPEN-SOURCE SCRIPT
Pure Price Zone Flow
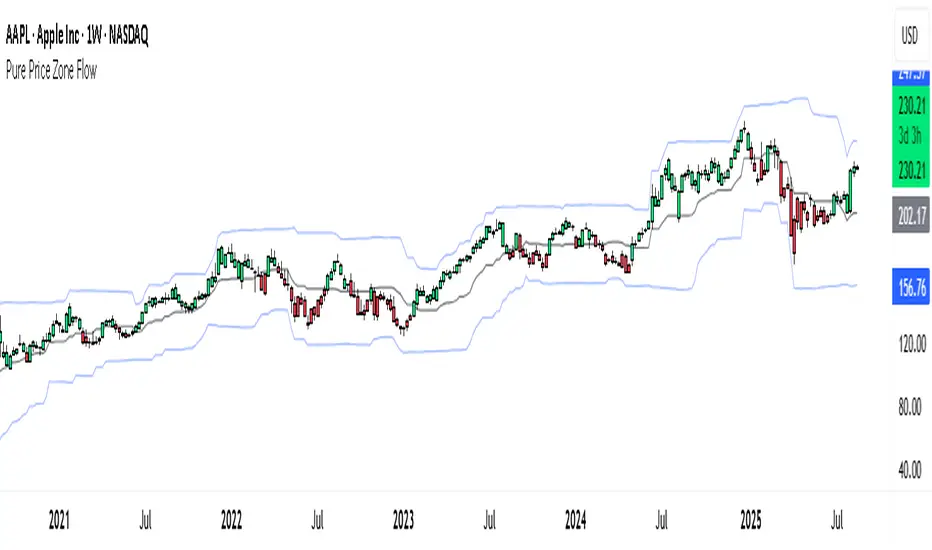
🔎 What this indicator is
It’s a price-action-based zone indicator. Unlike moving average systems, this one relies only on:
1. Swing Highs & Swing Lows → The highest and lowest points within a recent lookback period (like "mini support & resistance").
2. ATR (Average True Range) → A volatility measure that expands the zone, making it more adaptive to different market conditions.
3. Breakouts & Retests → When price breaks above a swing high (bullish) or below a swing low (bearish), the indicator marks it and highlights the new trend.
👉 The goal is to spot clean structure shifts and define clear trend zones where traders can position themselves.
________________________________________
⚙️ How it is calculated
1. Swing High & Swing Low
o We look back len candles (default 20).
o Find the highest high (swingHigh) and the lowest low (swingLow) in that window.
o This forms the price range zone.
2. ATR Expansion
o We calculate ATR over the same len.
o Add/subtract it (multiplied by atrMult) to the zone edges to expand them.
o This ensures the zones breathe with volatility (tight in quiet markets, wide in choppy ones).
3. Mid-Zone
o Simply the average of swingHigh and swingLow.
o If price is above mid → bullish bias.
o If below mid → bearish bias.
o This gives us the trend color for candles.
4. Breakouts
o If the close crosses above swingHigh, we mark a bullish breakout with a label.
o If the close crosses below swingLow, we mark a bearish breakdown.
________________________________________
📊 How it helps traders
This indicator helps by:
1. Identifying Structure Shifts
o Many traders watch swing highs/lows for breakouts or reversals.
o This automates the process and visually confirms when structure is broken.
2. Dynamic Zone Trading
o Instead of fixed support/resistance, the ATR expansion adapts to volatility.
o This avoids false signals in high-volatility conditions.
3. Trend Bias at a Glance
o Candle coloring instantly tells you whether price is in bullish or bearish territory relative to the mid-zone.
4. Breakout Confirmation
o The labels show when a breakout has occurred, so traders can react quickly (e.g., enter with trend, wait for retest, or avoid fading moves).
________________________________________
🌍 Markets it works best in
• Crypto (Bitcoin, Ethereum, etc.): Very effective since crypto is breakout-driven and respects swing levels.
• Forex: Good for volatility-adaptive structure analysis, especially in trending pairs.
• Indices (SPX, NASDAQ, DAX, NIFTY): Useful for breakout trading during session opens or key news events.
• Commodities (Gold, Oil, Silver): Works well to define intraday ranges and breakout levels.
⚠️ Less useful in low-volatility, mean-reverting assets (like some penny stocks or sideways ranges), because breakouts may be rare or fake.
________________________________________
💡 How it adds value
• Strips away unnecessary complexity (no lagging averages).
• Focuses directly on what price is doing structurally.
• Adaptive → works across different markets & timeframes.
• Easy visualization → zones, trend coloring, breakout markers.
• Helps traders trade with the flow of the market, instead of guessing tops/bottoms.
________________________________________
👉 In short:
This indicator turns raw price action into clear, actionable zones.
It highlights when the market shifts from balance to breakout, so traders can align with momentum rather than fighting it.
Open-source script
In true TradingView spirit, the creator of this script has made it open-source, so that traders can review and verify its functionality. Kudos to the author! While you can use it for free, remember that republishing the code is subject to our House Rules.
Trade forex, indices, stocks and metals with up to US$100.000 in company's funding.
Complete a challenge to access funding or go for instant deposit.
Trading involves substantial risk. Not financial advice
Complete a challenge to access funding or go for instant deposit.
Trading involves substantial risk. Not financial advice
Disclaimer
The information and publications are not meant to be, and do not constitute, financial, investment, trading, or other types of advice or recommendations supplied or endorsed by TradingView. Read more in the Terms of Use.