OPEN-SOURCE SCRIPT
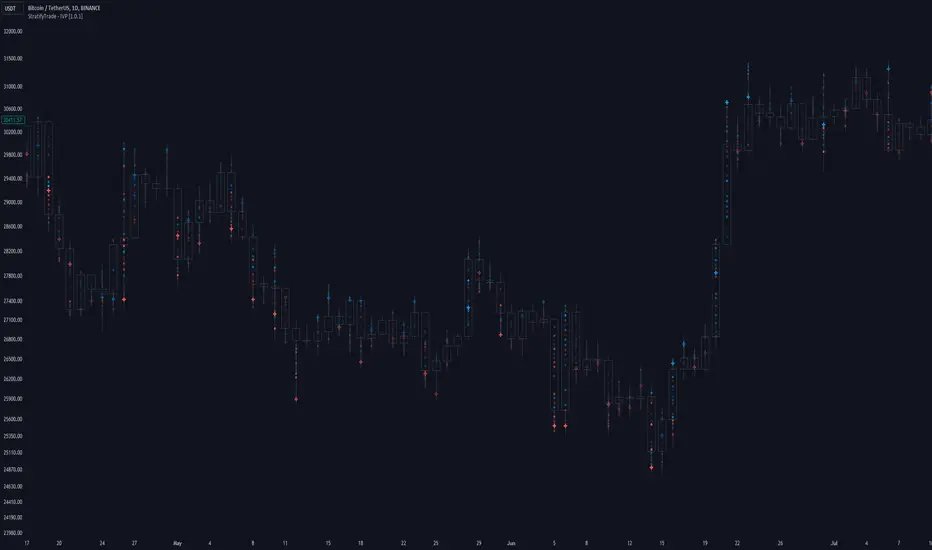
Updated Intraday Volume Profile [BigBeluga]

The Intraday Volume Profile aims to show delta volume on lower timeframes to spot trapped shorts at the bottom or trapped longs at the top, with buyers pushing the price up at the bottom and sellers at the top acting as resistance.
🔶 FEATURES
The indicator includes the following features:
🔶 DELTA EXAMPLE

In the image above, we can see how delta is created.
If delta is positive, we know that buyers have control over sellers, while if delta is negative, we know sellers have control over buyers.
Using this data, we can spot interesting trades and identify trapped individuals within the candle.


🔶 HOW TO USE

In the image above, we can see how shorts are trapped at the bottom of the wick (red + at the bottom), leading to a pump also called a "short squeeze."

Same example as before, but with trapped longs (blue + at the top).
This can also work as basic support and resistance, for example, trapped shorts at the bottom with positive delta at the bottom acting as strong support for price.


Users can have the option to also display delta data within the corresponding levels, showing Buyers vs Sellers for more precise trading ideas.
NOTE:
🔶 FEATURES
The indicator includes the following features:
- LTF Delta precision (timeframe)
- Sensibility color - adjust gradient color sensitivity
- Source - source of the candle to use as the main delta calculation
- Color mode - display delta coloring in different ways
🔶 DELTA EXAMPLE
In the image above, we can see how delta is created.
If delta is positive, we know that buyers have control over sellers, while if delta is negative, we know sellers have control over buyers.
Using this data, we can spot interesting trades and identify trapped individuals within the candle.
🔶 HOW TO USE
In the image above, we can see how shorts are trapped at the bottom of the wick (red + at the bottom), leading to a pump also called a "short squeeze."
Same example as before, but with trapped longs (blue + at the top).
This can also work as basic support and resistance, for example, trapped shorts at the bottom with positive delta at the bottom acting as strong support for price.
Users can have the option to also display delta data within the corresponding levels, showing Buyers vs Sellers for more precise trading ideas.
NOTE:
- User can only display the most recent data for the last 8 buyers and sellers.
- It is recommended to use a hollow candle while using this script.
Release Notes
- Updated theme
- Fixed plot delta calculation
Release Notes
- Added VWMA weighted by delta volume
Open-source script
In true TradingView spirit, the creator of this script has made it open-source, so that traders can review and verify its functionality. Kudos to the author! While you can use it for free, remember that republishing the code is subject to our House Rules.
🔵Gain access to our powerful tools : bigbeluga.com
🔵Join our free discord for updates : bigbeluga.com/discord
All scripts & content provided by BigBeluga are for informational & educational purposes only.
🔵Join our free discord for updates : bigbeluga.com/discord
All scripts & content provided by BigBeluga are for informational & educational purposes only.
Disclaimer
The information and publications are not meant to be, and do not constitute, financial, investment, trading, or other types of advice or recommendations supplied or endorsed by TradingView. Read more in the Terms of Use.