OPEN-SOURCE SCRIPT
Updated LEAN Change
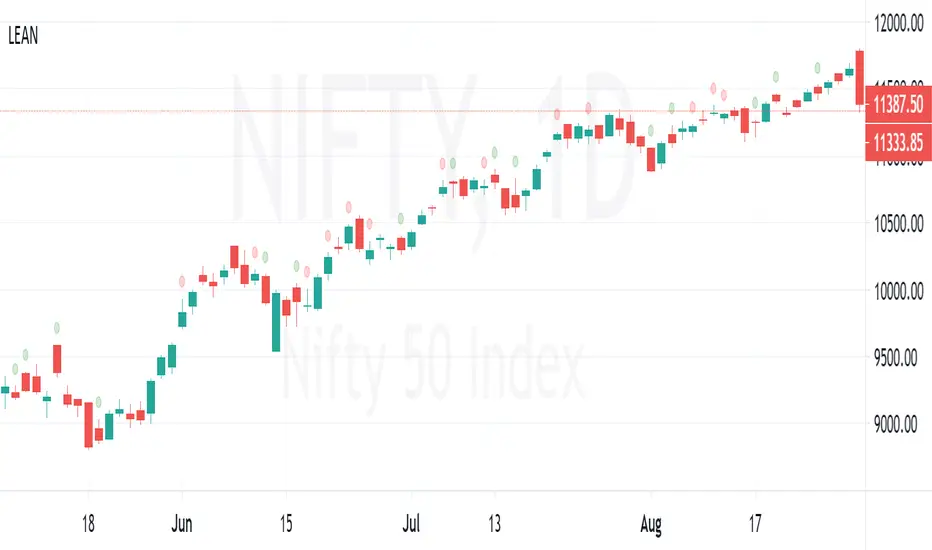
LEAN = Difference between %K and %D values of stochastic
Change in LEAN is plotted over the bar as a "Circle"
RED Circle => LEAN is decreased from previous value
GREEN Circle => LEAN is increased from previous value
Value of LEAN can be viewed at data window.
Change in LEAN is plotted over the bar as a "Circle"
RED Circle => LEAN is decreased from previous value
GREEN Circle => LEAN is increased from previous value
Value of LEAN can be viewed at data window.
Release Notes
Added option to view the change in Lean only if it moved in adverse direction of price (change in Lean is positive on Red bar or change in Lean is negative on Green bar)Open-source script
In true TradingView spirit, the creator of this script has made it open-source, so that traders can review and verify its functionality. Kudos to the author! While you can use it for free, remember that republishing the code is subject to our House Rules.
Disclaimer
The information and publications are not meant to be, and do not constitute, financial, investment, trading, or other types of advice or recommendations supplied or endorsed by TradingView. Read more in the Terms of Use.
Open-source script
In true TradingView spirit, the creator of this script has made it open-source, so that traders can review and verify its functionality. Kudos to the author! While you can use it for free, remember that republishing the code is subject to our House Rules.
Disclaimer
The information and publications are not meant to be, and do not constitute, financial, investment, trading, or other types of advice or recommendations supplied or endorsed by TradingView. Read more in the Terms of Use.