OPEN-SOURCE SCRIPT
Relative Volume at Time
The Relative Volume at Time indicator (RVOL) is a simple modification of the original Relative Volume at Time script available in TradingView’s public library. It doesn’t change how the indicator works but includes two small adjustments:
Aside from these small tweaks, the indicator retains all of its original functionality, including the ability to set an anchor timeframe, choose between Regular and Cumulative volume calculation modes, and adjust unconfirmed volume for incomplete bars.
This version exists simply because I needed a more personalized display for an indicator that I rely on daily.
How It Works
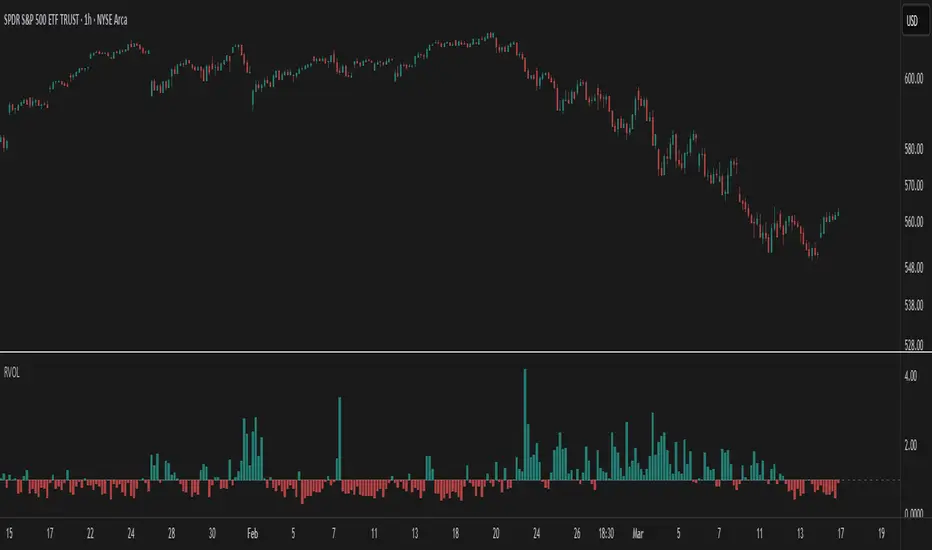
The Relative Volume at Time indicator compares the current volume to the average volume at the same time in previous sessions. This helps determine if today’s activity is higher or lower than usual.
Examples
This logic applies to any timeframe. It always compares the current volume to past volumes at the same point in time.
Julien_Eche
- Added Color Options – The ability to customize the colors of the volume bars, which was important to me as I use this indicator all the time and wanted more visually suitable colors.
- Renamed Short Title – The abbreviation "RVOL" replaces "RelVol", as it's a more commonly used term in trading.
Aside from these small tweaks, the indicator retains all of its original functionality, including the ability to set an anchor timeframe, choose between Regular and Cumulative volume calculation modes, and adjust unconfirmed volume for incomplete bars.
This version exists simply because I needed a more personalized display for an indicator that I rely on daily.
How It Works
The Relative Volume at Time indicator compares the current volume to the average volume at the same time in previous sessions. This helps determine if today’s activity is higher or lower than usual.
Examples
- On a daily chart (1D timeframe, length = 10), each volume bar compares today's volume to the average volume at the same time over the last 10 days. If today’s volume is higher than usual at this moment, the bar will reflect that.
- On an hourly chart (1H timeframe, length = 5), each hourly volume bar compares the current hour’s volume to the same hour in the past 5 days. If the 10 AM bar is high, it means today's 10 AM volume is greater than the average of the past 5 sessions at 10 AM.
- On a weekly chart (1W timeframe, length = 8), the indicator compares this week’s volume to the average of the last 8 weeks. A higher bar means this week is seeing significantly more volume than usual.
This logic applies to any timeframe. It always compares the current volume to past volumes at the same point in time.
Julien_Eche
Open-source script
In true TradingView spirit, the creator of this script has made it open-source, so that traders can review and verify its functionality. Kudos to the author! While you can use it for free, remember that republishing the code is subject to our House Rules.
The trend is your friend, until it's not...
Disclaimer
The information and publications are not meant to be, and do not constitute, financial, investment, trading, or other types of advice or recommendations supplied or endorsed by TradingView. Read more in the Terms of Use.