OPEN-SOURCE SCRIPT
Volume USDT
Name:
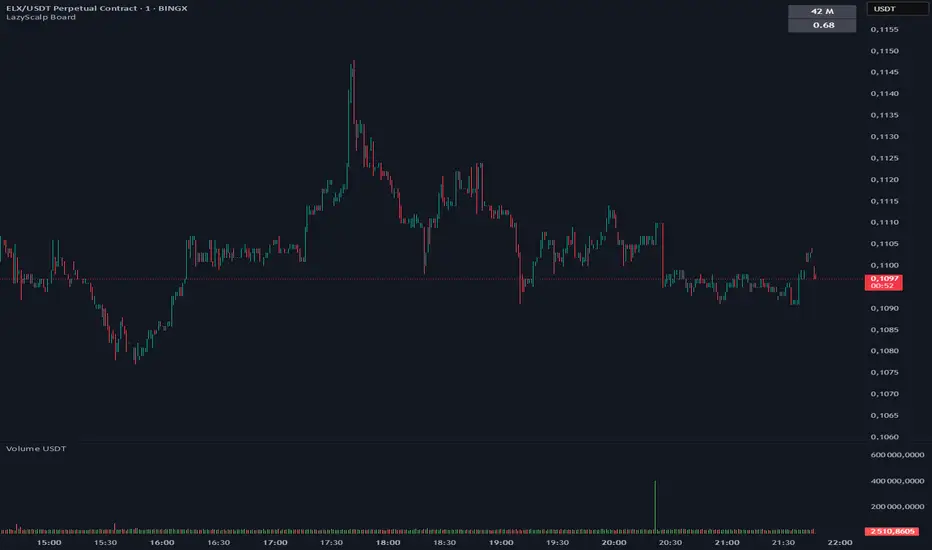
USDT Volume Bars (Directional Colors)
Description:
This indicator visualizes trading volume in USDT by multiplying the candle's volume by the average of its open and close prices. The result reflects a more realistic estimation of the traded value per candle.
🟩 Green bars: Bullish or neutral candles (close ≥ open)
🟥 Red bars: Bearish candles (close < open)
Useful for spotting high-value inflows and outflows based on actual price-weighted volume.
Open-source script
In true TradingView spirit, the creator of this script has made it open-source, so that traders can review and verify its functionality. Kudos to the author! While you can use it for free, remember that republishing the code is subject to our House Rules.
Disclaimer
The information and publications are not meant to be, and do not constitute, financial, investment, trading, or other types of advice or recommendations supplied or endorsed by TradingView. Read more in the Terms of Use.