OPEN-SOURCE SCRIPT
Updated Forward Curve Visualization Tool
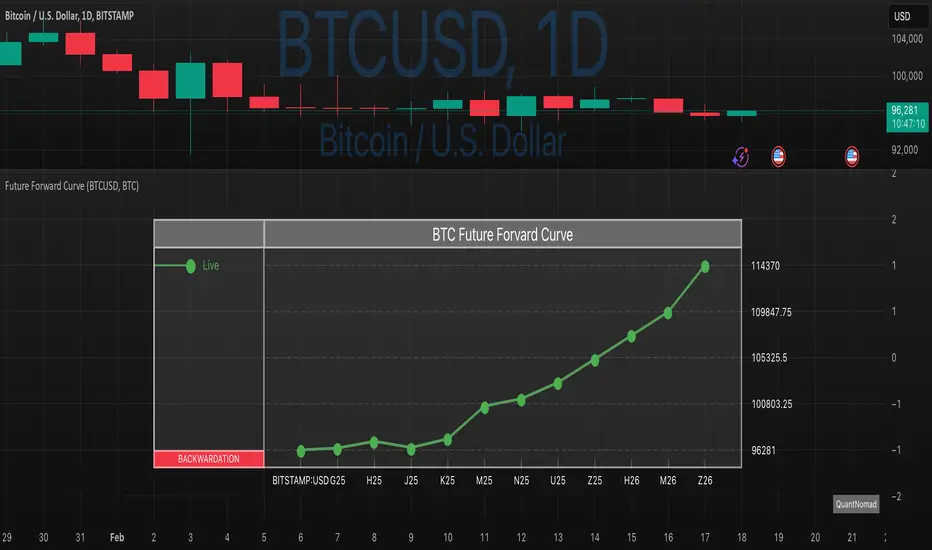
Provide the spot symbol and the futures product root, and the script automatically scans all relevant contracts for you—no more tedious manual searches. The result is a clean, intuitive chart showing the live forward curve in real time.
It also detects contango or backwardation conditions (based on spot < F1 < F2 < F3).
Future Features:
If you trade futures and watch the forward curve, this script will give you the actionable data you need and get more ideas or features you’d like to see. Let’s build them together!
Disclaimer
Please remember that past performance may not be indicative of future results.
Due to various factors, including changing market conditions, the strategy may no longer perform as well as in historical backtesting.
This post and the script don’t provide any financial advice.
It also detects contango or backwardation conditions (based on spot < F1 < F2 < F3).
Future Features:
- Plot historical snapshots of the curve (1 day, 1 week, or 1 month ago) to understand market trends over time.
- Display additional metrics such as annualized basis, cost of carry (CoC), and even volume or open interest for deeper insights.
If you trade futures and watch the forward curve, this script will give you the actionable data you need and get more ideas or features you’d like to see. Let’s build them together!
Disclaimer
Please remember that past performance may not be indicative of future results.
Due to various factors, including changing market conditions, the strategy may no longer perform as well as in historical backtesting.
This post and the script don’t provide any financial advice.
Release Notes
A bit on what is Forward Curve and how you can use it: What Is a Futures Forward Curve?
A forward curve (also called a futures curve) is a graphical representation of the prices for futures contracts on the same underlying asset but with different expiration dates. By plotting each contract’s settlement price (y-axis) against its expiration month or date (x-axis), traders get a snapshot of how the market is pricing that asset at various points in the future.
Key Points
Contango: The futures curve slopes upward, with further-dated contracts trading at higher prices than nearer-dated ones. Contango often reflects storage costs, financing costs, or lower immediate demand relative to future expectations.
Backwardation: The futures curve slopes downward, with further-dated contracts trading at lower prices than nearer-dated ones. Backwardation often implies a higher immediate demand (or supply tightness) versus future expectations.
How Do Traders Use It?
Traders look at the forward curve to assess the market’s outlook on supply and demand, interest rates, storage costs, and other factors that affect future pricing. Some common ways it’s used:
Hedging: Commercial producers or consumers of a commodity can lock in future prices, while speculators can hedge positions (long or short) based on expected price movements.
Arbitrage Opportunities: Differences between spot prices, near-month futures, and further-month futures may present trading opportunities (e.g., calendar spreads).
Carry Trades: Traders might exploit contango (where rolling futures can incur costs) or backwardation (where rolling futures might yield gains).
Signals on Market Sentiment: A steepening or flattening curve can signal shifts in supply/demand expectations and market sentiment.
Open-source script
In true TradingView spirit, the creator of this script has made it open-source, so that traders can review and verify its functionality. Kudos to the author! While you can use it for free, remember that republishing the code is subject to our House Rules.
💻 Online Courses and Access to PRO Indicators in the QuanTribe community: qntly.com/qt
💼 Hire Us: qntly.com/pine
📞 Book a call: qntly.com/cons
📰 qntly.com/news
𝕏: qntly.com/x
📩 qntly.com/tel
💼 Hire Us: qntly.com/pine
📞 Book a call: qntly.com/cons
📰 qntly.com/news
𝕏: qntly.com/x
📩 qntly.com/tel
Disclaimer
The information and publications are not meant to be, and do not constitute, financial, investment, trading, or other types of advice or recommendations supplied or endorsed by TradingView. Read more in the Terms of Use.