OPEN-SOURCE SCRIPT
Dashboard Trends
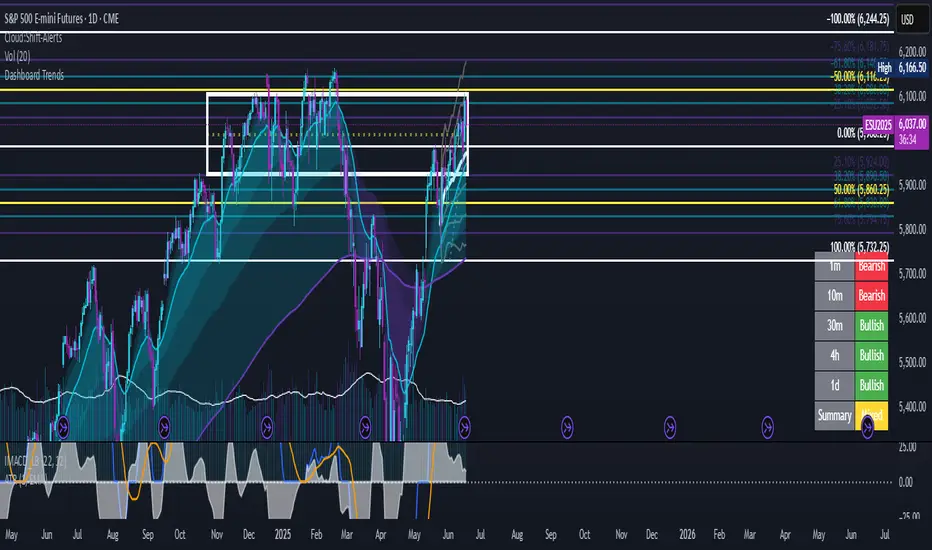
MA Dashboard Trend Lights
This indicator displays a real-time dashboard of market trend signals across multiple timeframes using the 22 EMA vs 200 EMA crossover method:
Green = Bullish (22 EMA above 200 EMA)
Red = Bearish (22 EMA below 200 EMA)
The dashboard covers the following timeframes:
1 minute
10 minute
30 minute
4 hour
1 day
A summary signal aggregates all five lights to classify overall market sentiment as:
Strong Bull (5 green)
Bull (4 green)
Mixed (2–3 green)
Bear (1 green)
Strong Bear (0 green)
📈 Interpretation Tips:
When the short-term timeframes (1m, 10m, 30m) are red while the 4h and 1d are green, the market is likely in a short-term pullback within a larger bullish trend.
If the short-term timeframes are green but the 4h and 1d are red, this could signal a bear market rally or a dead cat bounce — a temporary rise in a longer-term downtrend.
Open-source script
In true TradingView spirit, the creator of this script has made it open-source, so that traders can review and verify its functionality. Kudos to the author! While you can use it for free, remember that republishing the code is subject to our House Rules.
Disclaimer
The information and publications are not meant to be, and do not constitute, financial, investment, trading, or other types of advice or recommendations supplied or endorsed by TradingView. Read more in the Terms of Use.