OPEN-SOURCE SCRIPT
Trend Strength Index [Alpha Extract]
The Trend Strength Index leverages Volume Weighted Moving Average (VWMA) and Average True Range (ATR) to quantify trend intensity in cryptocurrency markets, particularly Bitcoin. The combination of VWMA and ATR is particularly powerful because VWMA provides a more accurate representation of the market's true average price by weighting periods of higher trading volume more heavily—capturing genuine momentum driven by increased participation rather than treating all price action equally, which is crucial in volatile assets like Bitcoin where volume spikes often signal institutional interest or market shifts.
Meanwhile, ATR normalizes this measurement for volatility, ensuring that trend strength readings remain comparable across different market conditions; without ATR's adjustment, raw price deviations from the mean could appear artificially inflated during high-volatility periods (like during news events or liquidations) or understated in low-volatility sideways markets, leading to misleading signals. Together, they create a volatility-adjusted, volume-sensitive metric that reliably distinguishes between meaningful trend developments and noise.
This indicator measures the normalized distance between price and its volume-weighted mean, providing a clear visualization of trend strength while accounting for market volatility. It helps traders identify periods of strong directional movement versus consolidation, with color-coded gradients for intuitive interpretation.
🔶 CALCULATION
The indicator processes price data through these analytical stages:
🔶 DETAILS Visual Features:
Interpretation:
🔶 EXAMPLES
Example: Trend strength briefly falling to yellow levels (e.g., 0.8-1.1) after hitting green provides profit-taking signals without invalidating the overall bullish bias if the VWMA holds as support.
Threshold Alert Integration: The alert condition combines strength value with the enter threshold for timely notifications.
Example: Receiving a "Strong Trend Detected" alert when the area plot turns green helps confirm Bitcoin's breakout from consolidation, aligning with increased volume for higher-probability trades.
🔶 SETTINGS
Customization Options:
The Trend Strength Index equips traders with a robust, easy-to-interpret tool for gauging trend intensity in volatile markets like Bitcoin. By normalizing price deviations against volatility, it delivers reliable signals for identifying high-momentum opportunities while the gradient coloring and alerts facilitate quick assessments in both trending and choppy conditions.
Meanwhile, ATR normalizes this measurement for volatility, ensuring that trend strength readings remain comparable across different market conditions; without ATR's adjustment, raw price deviations from the mean could appear artificially inflated during high-volatility periods (like during news events or liquidations) or understated in low-volatility sideways markets, leading to misleading signals. Together, they create a volatility-adjusted, volume-sensitive metric that reliably distinguishes between meaningful trend developments and noise.
This indicator measures the normalized distance between price and its volume-weighted mean, providing a clear visualization of trend strength while accounting for market volatility. It helps traders identify periods of strong directional movement versus consolidation, with color-coded gradients for intuitive interpretation.
🔶 CALCULATION
The indicator processes price data through these analytical stages:
- Volume Weighted Moving Average: Computes a smoothed average weighted by trading volume
- Volatility Normalization: Uses ATR to account for market volatility
- Distance Measurement: Calculates absolute deviation between current price and VWMA
- Strength Normalization: Divides price deviation by ATR for a volatility-adjusted metric
Formula: - VWMA = Volume-Weighted Moving Average of Close over specified length
- ATR = Average True Range over specified length
- Price Distance = |Close - VWMA|
- Trend Strength = Price Distance / ATR
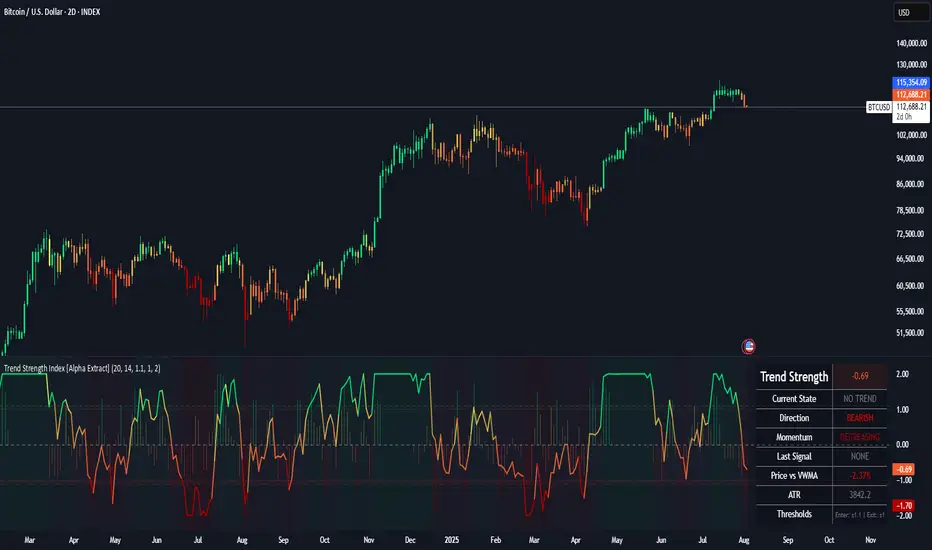
🔶 DETAILS Visual Features:
- VWMA Line: Blue line overlay on the price chart representing the volume-weighted mean
- Trend Strength Area: Histogram-style area plot with dynamic color gradient (red for weak trends, transitioning through orange and yellow to green for strong trends)
- Threshold Line: Horizontal red line at the customizable Trend Enter level
- Background Highlight: Subtle green background when trend strength exceeds the enter threshold for strong trend visualization
- Alert System: Triggers notifications for strong trend detection
Interpretation:
- 0-Weak (Red): Minimal trend strength, potential consolidation or ranging market
- Mid-Range (Orange/Yellow): Building momentum, watch for breakout potential
- At/Above Enter Threshold (Green): Strong trend conditions, potential for continued directional moves
- Threshold Crossing: Trend strength crossing above the enter level signals increasing conviction in the current direction
- Color Transitions: Gradual shifts from warm (red/orange) to cool (green) tones indicate strengthening trends
🔶 EXAMPLES
- Strong Trend Entry: When trend strength crosses above the enter threshold (e.g., 1.2), it identifies the onset of a powerful move where price deviates significantly from the mean.
- Example: During a rally, trend strength rising from yellow (around 1.0) to green (1.2+) often precedes sustained upward momentum, providing entry opportunities for trend followers.
- Consolidation Detection: Low trend strength values in red shades (below 0.5) highlight periods of low volatility and mean reversion potential.
- Example: After a sharp sell-off, persistent red values signal a likely sideways phase, allowing traders to avoid whipsaws and wait for orange/yellow transitions as a precursor to recovery.
- Volatility-Adjusted Pullbacks: In volatile markets, the ATR component ensures trend strength remains accurate; a dip back to yellow from green during minor corrections can indicate healthy pullbacks within a strong trend.
Example: Trend strength briefly falling to yellow levels (e.g., 0.8-1.1) after hitting green provides profit-taking signals without invalidating the overall bullish bias if the VWMA holds as support.
Threshold Alert Integration: The alert condition combines strength value with the enter threshold for timely notifications.
Example: Receiving a "Strong Trend Detected" alert when the area plot turns green helps confirm Bitcoin's breakout from consolidation, aligning with increased volume for higher-probability trades.
🔶 SETTINGS
Customization Options:
- Lengths: VWMA length (default 14), ATR length (default 14)
- Thresholds: Trend enter (default 1.2, step 0.1), trend exit (default 1.15, for potential future signal enhancements)
- Visuals: Automatic color scaling with red at 0, transitioning to green at/above enter threshold
- Alert Conditions: Strong trend detection (when strength > enter)
The Trend Strength Index equips traders with a robust, easy-to-interpret tool for gauging trend intensity in volatile markets like Bitcoin. By normalizing price deviations against volatility, it delivers reliable signals for identifying high-momentum opportunities while the gradient coloring and alerts facilitate quick assessments in both trending and choppy conditions.
Open-source script
In true TradingView spirit, the creator of this script has made it open-source, so that traders can review and verify its functionality. Kudos to the author! While you can use it for free, remember that republishing the code is subject to our House Rules.
Access more of our systems and insights at alphaextract.xyz
All analysis provided by Alpha Extract is for educational and informational purposes only.
All analysis provided by Alpha Extract is for educational and informational purposes only.
Disclaimer
The information and publications are not meant to be, and do not constitute, financial, investment, trading, or other types of advice or recommendations supplied or endorsed by TradingView. Read more in the Terms of Use.