Innotrade LSOB Fractal Zones for Sniper Entry
This all-in-one indicator suite is a comprehensive toolkit designed for discretionary traders who leverage multiple confluence factors in their analysis. It integrates nine distinct, powerful, and complementary trading systems into a single, cohesive interface. The primary purpose of this script is not just to build an indicator, but to create a synergistic framework where signals from one system can be validated by others, providing a higher-probability trading environment.
The core philosophy is built around identifying Liquidity Sweep Order Blocks (LSOB) that form after sweeping significant Fractal price points. This combination pinpoints where institutional players have likely shown their hand, leaving behind clues for the retail trader to follow. The additional modules for trend, volume, structure, and multi-timeframe momentum provide the essential context needed to filter trades and boost confidence.
How Each System Works and Complements the Others
This suite is built on the principle of confluence. A signal from one system gains significance when confirmed by one or more of the other systems. Below is a breakdown of each component and its role within the suite:
1. Innotrade LSOB Fractal Zones
What it does: This core component automatically identifies and plots high-probability order blocks. Unlike standard order block indicators, the LSOB is specifically formed after a liquidity sweep of a recent, significant Fractal pivot high or low. These "sniper entry" zones represent areas where institutional orders are likely resting after engineering liquidity.
Key Enhancements & New Features:
Extensive Multi-Timeframe (MTF) Analysis: Plot LSOB zones from up to 5 Higher Timeframes (HTF) and 5 Lower Timeframes (LTF) directly on your current chart. This provides a complete, top-down view of supply and demand, showing where major and minor reversal zones are stacking up.
ATR Impulse Invalidation: An intelligent filter that automatically removes an LSOB zone if a strong counter-move (measured by the Average True Range) closes decisively against it. This keeps your chart clean by removing invalidated zones.
Advanced Alert System: Go beyond simple entry alerts with a sophisticated alert suite:
Zone Entry Alert: Standard alert when price first touches an LSOB zone.
Confirmation (Rejection) Alert: Triggers when price enters a zone and then closes back outside of it, providing powerful confirmation of a rejection and potential reversal.
Break-and-Retest (S/R Flip) Alert: A powerful feature for trend-continuation traders. When an LSOB zone is broken, the indicator remembers it. If price later returns to retest this broken zone from the opposite side (e.g., retesting a broken resistance as new support), an alert is triggered.
How to use it: The LSOB zones are your primary areas of interest for entries. A bullish LSOB forming on a key Octo MA level, confirmed by the MTF Dashboard, is a high-probability long setup.
2. Innotrade Octo MA (8 Moving Averages)
What it does: The Octo MA is the backbone of this suite, providing a clear, multi-layered view of the market trend. It plots eight fully customizable moving averages (SMA, EMA, SMMA) and their corresponding standard deviation clouds.
New Features:
Flow/Slope Coloring: An optional mode colors the MAs and clouds based on their angle (up or down), offering an immediate visual cue of momentum strength.
MA Value Labels: Display clean labels for each MA value on the last bar, with a connector line to keep the chart organized.
Synergy: The Octo MA provides the essential trend context. An LSOB signal is stronger if it forms at a key MA level. A Momentum Crossover signal is more reliable when the longer-term MAs from the Octo suite are aligned.
3. Momentum Crossover & RSI System
What it does: This system provides clear entry signals based on MA crossovers, filtered by the RSI to avoid chasing exhausted moves.
How it works: Select any two of the eight Octo MAs as your fast and slow lines. A long signal is generated on a pullback to the fast MA while it's above the slow MA, and when the RSI is not overbought. This encourages buying dips in an uptrend.
Synergy: This system gives you specific, actionable entry triggers within the broader context provided by the LSOB zones and the Octo MA trend. An entry signal here that occurs inside an LSOB zone is a very high-confidence setup.
4. PVSRA Volume Coloring
What it does: PVSRA (Price, Volume, Spread, Range Analysis) colors candles based on volume analysis to reveal the strength or weakness behind a move. It identifies high-volume (Vectors) and ultra-high-volume exhaustion candles (Climax Vectors).
Synergy: A climactic volume signal (Blue/Violet) appearing at an LSOB zone can signal an impending reversal, providing powerful confirmation for entry timing.
5. Fibonacci Time Cycles
What it does: This tool projects potential future turning points based on Fibonacci time sequences (21, 34, 55, etc.), starting from a significant user-defined pivot.
Synergy: When a price-based signal (like a touch of an LSOB zone) coincides with a Fibonacci time cycle line, it suggests that both price and time are aligned for a potential market turn.
6. Psy-Levels & Daily Open
What it does: This component plots key psychological price levels for the week (Psy-High and Psy-Low) and the daily opening price, which act as crucial intraday pivots.
Synergy: These levels act as natural magnets or areas of S/R. An LSOB block that forms right at a weekly Psy-Low provides a powerful confluence for a potential reversal.
7. Classic Fractals
What it does: Identifies simple 3-bar or 5-bar fractal patterns, which are basic short-term swing highs and lows.
Synergy: These fractals provide a quick visual confirmation of the swing points that the LSOB system uses for its liquidity sweep detection, helping to validate the identified zones.
8. Zig-Zag
What it does: The Zig-Zag overlay filters out market noise to visualize the most significant price swings and overall market structure.
Synergy: The Zig-Zag provides a "big picture" view of market structure, helping you confirm that your trade setup (e.g., from an LSOB zone) is aligned with the major swings of the market.
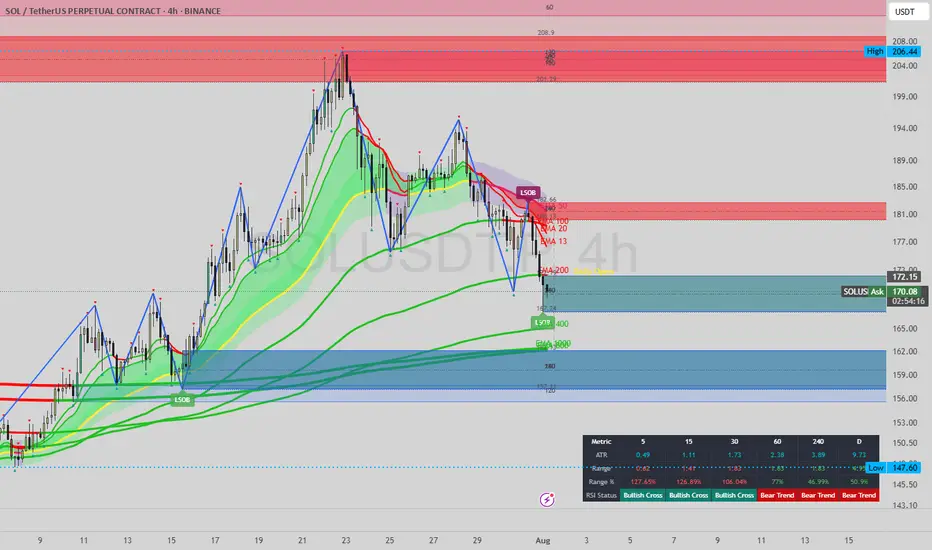
9. ATR & RSI Multi-Timeframe Dashboard (NEW)
What it does: This is a powerful, at-a-glance dashboard that provides a comprehensive overview of market conditions across six user-defined timeframes. It tracks two key metrics:
Volatility (ATR vs. Range): It displays the current ATR, the current bar's range, and the range as a percentage of the ATR. Crucially, it highlights when the current range exceeds the ATR, alerting you to unusual, expansionary volatility.
Momentum (RSI Status): It analyzes the RSI on each timeframe and provides a simple, color-coded status: Bull Trend, Bear Trend, Bullish Cross, or Bearish Cross. This goes beyond a simple RSI value, giving you immediate, actionable context on momentum.
How it works: The dashboard synthesizes complex data into an easy-to-read table. It also comes with its own dedicated alerts for both volatility expansion (Range > ATR) and changes in RSI status, keeping you informed of shifts in market dynamics across all key timeframes.
Synergy: The dashboard is the ultimate filter. Before taking an LSOB trade on the 15-minute chart, a quick glance can tell you if the 1H and 4H timeframes are in a strong "Bear Trend," allowing you to avoid a counter-trend trade with a low probability of success.
How to Use This Suite for a Trading Setup
Here is a sample workflow for identifying a high-probability long trade:
Context (Dashboard & MAs): Check the MTF Dashboard. Are the higher timeframes showing a "Bull Trend" or "Bullish Cross"? Check the Octo MA. Are the longer-term MAs (e.g., 50, 100, 200) trending upwards?
Area of Interest (LSOB & Levels): Look for a bullish LSOB zone to form, ideally from your current timeframe or a higher timeframe. Is it forming at a key support level like an Octo MA, a weekly Psy-Level, or a broken-and-retested resistance?
Confirmation (Volume): As price enters the LSOB zone, look for PVSRA signals. Is there a bullish vector (Green) or a sign of selling exhaustion (Blue climax candle at the low)?
Timing (Fib Cycles): Is this potential reversal aligning with a Fibonacci Time Cycle line? This adds another layer of confluence.
Entry Trigger (Momentum System): Wait for a Momentum Crossover system signal—a bullish cross or a pullback entry signal—to trigger your trade. The Zig-Zag should confirm you are buying at a higher low in the larger structure.
Stop Loss: Your stop loss can be placed just below the low of the LSOB zone.
By requiring multiple systems to align, you can filter out low-quality setups and focus on trades with a higher probability of success.
Vendor Requirements / How to Get Access (For Invite-Only Scripts)
To gain access to the Innotrade LSOB Zones indicator, please send me a private message on TradingView or follow the instructions in my signature.
Disclaimer
This indicator is a tool to aid in analysis and decision-making, not financial advice or a signal-calling system. Trading involves significant risk, and past performance is not indicative of future results. Always use proper risk management and never risk more than you are willing to lose.
Thank you for your interest, and I look forward to your feedback and comments
Invite-only script
Only users approved by the author can access this script. You'll need to request and get permission to use it. This is typically granted after payment. For more details, follow the author's instructions below or contact Innotrade_AJ directly.
TradingView does NOT recommend paying for or using a script unless you fully trust its author and understand how it works. You may also find free, open-source alternatives in our community scripts.
Author's instructions
Warning: please read our guide for invite-only scripts before requesting access.
Disclaimer
Invite-only script
Only users approved by the author can access this script. You'll need to request and get permission to use it. This is typically granted after payment. For more details, follow the author's instructions below or contact Innotrade_AJ directly.
TradingView does NOT recommend paying for or using a script unless you fully trust its author and understand how it works. You may also find free, open-source alternatives in our community scripts.
Author's instructions
Warning: please read our guide for invite-only scripts before requesting access.