OPEN-SOURCE SCRIPT
Updated VI BB RSI CRSI MFI - All In One
This script simply creates a combo of some indicators I have found to be useful to visualize together.
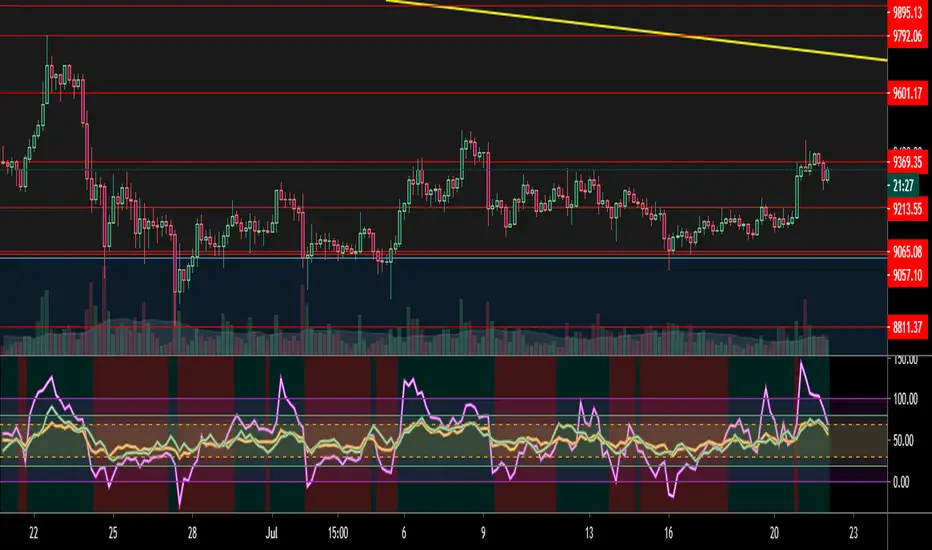
Its fairly simple to use... buy the red and sell the green. The red and green 'zones' are VI indicator plus and minus using color to identify instead of plotting the lines and creating more mess for us.
The blue line is our BB B%... and the solid lines are the buy and sell thresholds.
The yellow line is our RSI, and the dotted lines are the thresholds.
The orange CRSI line is for intrazone (red or green VI zone) trades.. for instance, buying in the sell zone and then selling again (dead cats) and vice versa.
Lastly the purple MFI plot can be useful in identifying trend reversals.
This is not secret code, its free for everyone to use. If you find that it is too cluttered, you can simply comment out the plot function for that indicator to disable the ones that you find most cluttering.
Feedback is appreciated, along with ideas or suggestions.. cheers and happy trading!
Release Notes
Added config for each indicator to config menuAdded timeframe selection to menu
Added ability to enable or disable each indicator
Added ability to enable or disable custom timeframe for each indicator
Release Notes
Really messy with everything enabled... you will need to disable the indicators you do not useRelease Notes
Fix multi timeframe repaintingRelease Notes
Remove checkbox to enable or disable timeframes... its unnecessary, can just select option same as symbolAdded Chaikin Oscillator indicator
Release Notes
Remove Chaikin Oscillator until I get it fixed =\Release Notes
Remove hline 50Default all indicators to current timeframe
Release Notes
Added Disable Repaint config option. To see this in action, add this indicator to your chart twice.. then disable the repaint on one of the indicators and run a replay with 1 week candles to see the difference between them.Release Notes
Remove unnecessary lookaheadRelease Notes
updated styling.. changed default colors to make them more visible and gave the indicators color matched tresh hold hlinesOpen-source script
In true TradingView spirit, the creator of this script has made it open-source, so that traders can review and verify its functionality. Kudos to the author! While you can use it for free, remember that republishing the code is subject to our House Rules.
Disclaimer
The information and publications are not meant to be, and do not constitute, financial, investment, trading, or other types of advice or recommendations supplied or endorsed by TradingView. Read more in the Terms of Use.
Open-source script
In true TradingView spirit, the creator of this script has made it open-source, so that traders can review and verify its functionality. Kudos to the author! While you can use it for free, remember that republishing the code is subject to our House Rules.
Disclaimer
The information and publications are not meant to be, and do not constitute, financial, investment, trading, or other types of advice or recommendations supplied or endorsed by TradingView. Read more in the Terms of Use.