OPEN-SOURCE SCRIPT
MCDX_Signal
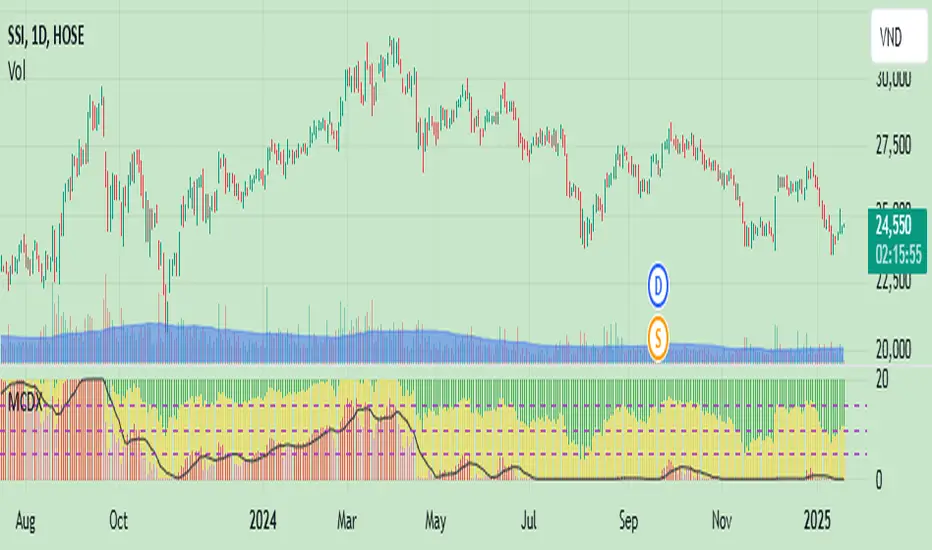
The MCDX indicator (Market Cycle Dynamic Index) is a technical indicator developed by Trung Pham. It is a tool used for analyzing the stock market, often utilized to identify big money flow (Big Money) and evaluate the strength of individual stocks or the overall market.
MCDX is known for its distinctive histogram chart with red and green bars. The red bars typically represent the inflow of big money, while the green bars indicate small money flow or outflows.
MCDX is known for its distinctive histogram chart with red and green bars. The red bars typically represent the inflow of big money, while the green bars indicate small money flow or outflows.
Open-source script
In true TradingView spirit, the creator of this script has made it open-source, so that traders can review and verify its functionality. Kudos to the author! While you can use it for free, remember that republishing the code is subject to our House Rules.
Disclaimer
The information and publications are not meant to be, and do not constitute, financial, investment, trading, or other types of advice or recommendations supplied or endorsed by TradingView. Read more in the Terms of Use.