OPEN-SOURCE SCRIPT
Updated EMAs Cross
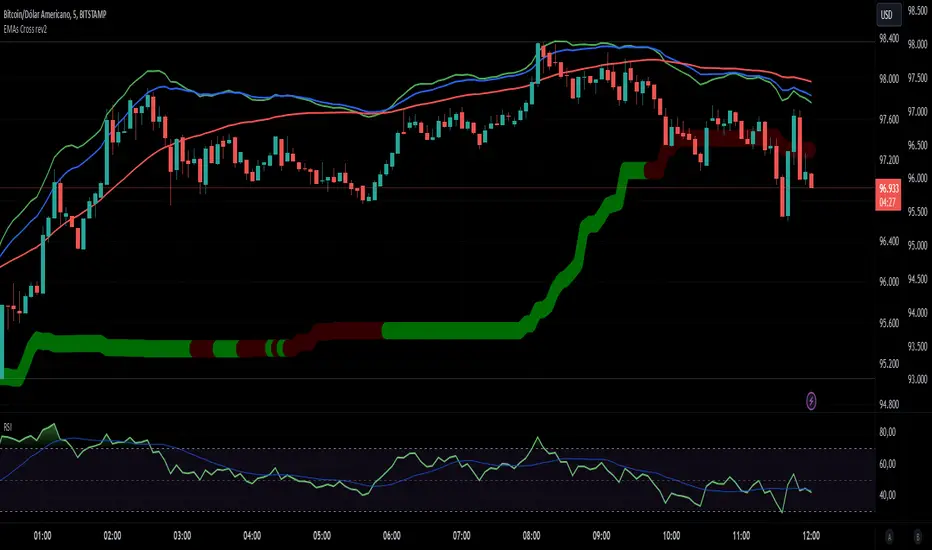
This script generates a line that changes color when evaluating the values and intersections of the 7-, 14-, and 42-day exponential averages, indicating possible entry and exit points.
In general, yellow indicates the beginning of an uptrend, green confirms an uptrend, and brown indicates a downtrend.
Using this script together with the RSI can help you make decisions about the best times to enter and exit positions.
The script was created to generate an indicator in a separate window from the main chart, but adding this indicator to the main window can help you visualize and interpret market movements.
Release Notes
This script generates a line that changes color when evaluating the values and intersections of the 7-, 14-, and 42-day exponential averages, indicating possible entry and exit points.In general, yellow indicates the beginning of an uptrend, green confirms an uptrend, and brown indicates a downtrend.
Using this script together with the RSI can help you make decisions about the best times to enter and exit positions.
The script was created to generate an indicator in a separate window from the main chart, but adding this indicator to the main window can help you visualize and interpret market movements.
This script replaces the EMA Cross.
Open-source script
In true TradingView spirit, the creator of this script has made it open-source, so that traders can review and verify its functionality. Kudos to the author! While you can use it for free, remember that republishing the code is subject to our House Rules.
Disclaimer
The information and publications are not meant to be, and do not constitute, financial, investment, trading, or other types of advice or recommendations supplied or endorsed by TradingView. Read more in the Terms of Use.