OPEN-SOURCE SCRIPT
Liquidity Heatmap (Nephew_Sam_)
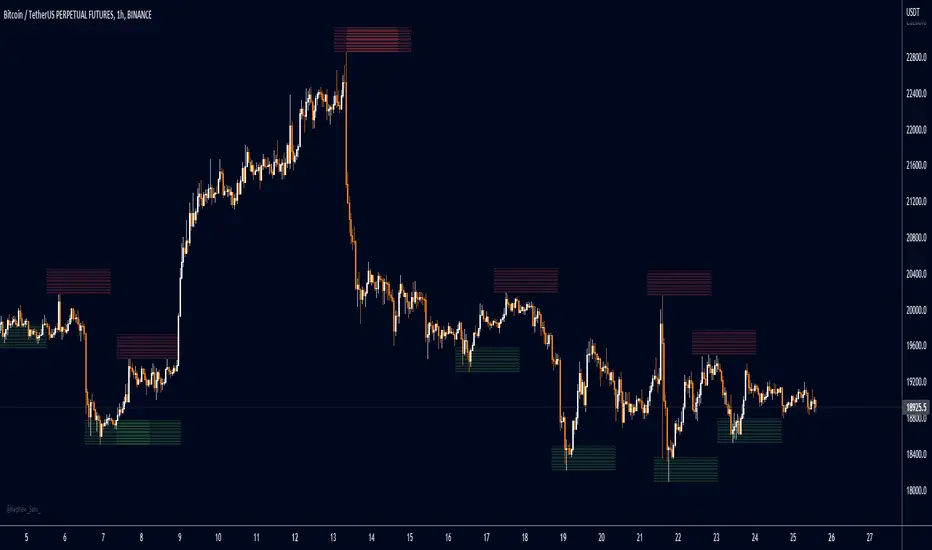
Liquidity Heatmap
This indicator plots a heatmap of resting liquidity above and below swing lows and multiple timeframes
The darker the color is or the larger the zone is, the more liquidity is lying there. If you think there are too many zones, you can increase the timeframes in the settings or just disable it.
Liquidity simply means orders such as stoplosses, buy/sell stops.
Disclaimer: You are free to use this code but your should be open source too
Release Notes
Updates for LTF + HTFOpen-source script
In true TradingView spirit, the creator of this script has made it open-source, so that traders can review and verify its functionality. Kudos to the author! While you can use it for free, remember that republishing the code is subject to our House Rules.
Disclaimer
The information and publications are not meant to be, and do not constitute, financial, investment, trading, or other types of advice or recommendations supplied or endorsed by TradingView. Read more in the Terms of Use.
Open-source script
In true TradingView spirit, the creator of this script has made it open-source, so that traders can review and verify its functionality. Kudos to the author! While you can use it for free, remember that republishing the code is subject to our House Rules.
Disclaimer
The information and publications are not meant to be, and do not constitute, financial, investment, trading, or other types of advice or recommendations supplied or endorsed by TradingView. Read more in the Terms of Use.