OPEN-SOURCE SCRIPT
Dynamic Heat Levels [BigBeluga]
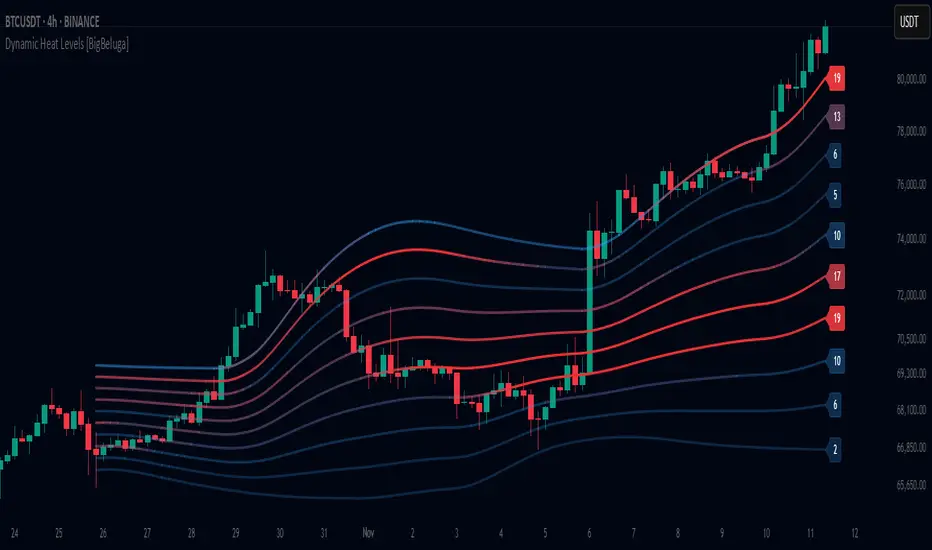
This indicator visualizes dynamic support and resistance levels with an adaptive heatmap effect. It helps traders identify key price interaction zones and potential mean reversion opportunities by displaying multiple levels that react to price movement.
🔵Key Features:
🔵Usage:
Dynamic Heat Levels [BigBeluga] is a powerful tool for traders looking to analyze price interaction zones with a heatmap effect. It offers a structured visualization of market dynamics, allowing traders to gauge the significance of key levels and detect mean reversion setups effectively.
🔵Key Features:
- Multi-Level Heatmap Channel:
- The indicator plots multiple dynamic levels forming a structured channel.
- Each level represents a historical price interaction zone, helping traders identify critical areas.
- The channel expands or contracts based on market conditions, adapting dynamically to price movements. - Heatmap-Based Strength Indication:
- Levels change in transparency and color intensity based on price interactions for the length period.
- The more frequently price interacts with a level, the more visible and intense the color becomes.
- When a level reaches a threshold (count > 10), it starts to turn red, signaling a high-heat zone with significant price activity.
🔵Usage:
- Support & Resistance Analysis: Identify price levels where the market frequently interacts, making them strong areas for trade decisions.
- Heatmap Strength Assessment: More intense red levels indicate areas with heavy price activity, useful for detecting key liquidity zones.
Dynamic Heat Levels [BigBeluga] is a powerful tool for traders looking to analyze price interaction zones with a heatmap effect. It offers a structured visualization of market dynamics, allowing traders to gauge the significance of key levels and detect mean reversion setups effectively.
Open-source script
In true TradingView spirit, the creator of this script has made it open-source, so that traders can review and verify its functionality. Kudos to the author! While you can use it for free, remember that republishing the code is subject to our House Rules.
🔵Gain access to our powerful tools : bigbeluga.com
🔵Join our free discord for updates : bigbeluga.com/discord
All scripts & content provided by BigBeluga are for informational & educational purposes only.
🔵Join our free discord for updates : bigbeluga.com/discord
All scripts & content provided by BigBeluga are for informational & educational purposes only.
Disclaimer
The information and publications are not meant to be, and do not constitute, financial, investment, trading, or other types of advice or recommendations supplied or endorsed by TradingView. Read more in the Terms of Use.