OPEN-SOURCE SCRIPT
DMI Percentile MTF
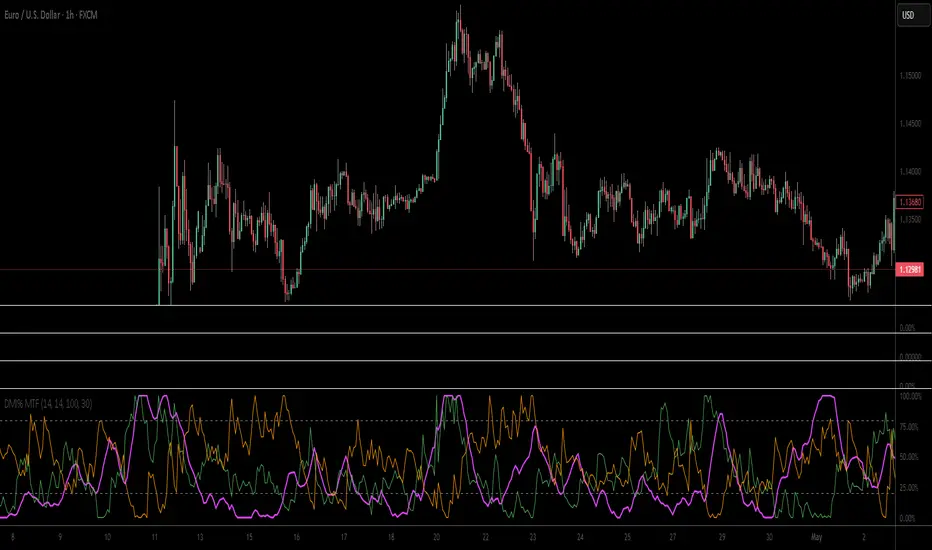
📈 DMI Percentile MTF – Custom Technical Indicator
This indicator is an enhanced version of the classic Directional Movement Index (DMI), converting +DI, -DI, and ADX values into dynamic percentiles ranging from 0% to 100%, making it easier to interpret the strength and direction of a trend.
⚙️ Key Features:
Percentile Normalization: Calculates where current values stand within a historical range (default: 100 bars), providing clearer overbought/oversold context.
+DI (green): Indicates bullish directional strength.
-DI (orange): Indicates bearish directional strength.
ADX (fuchsia): Measures overall trend strength (rising = strong trend, falling = flat market).
20% / 80% reference lines: Help identify weak or strong conditions.
Multi-Timeframe (MTF) Support: Analyze a higher timeframe trend (e.g., daily) while viewing a lower timeframe chart (e.g., 1h).
📊 How to Read It:
+DI > -DI → bullish trend dominance.
-DI > +DI → bearish trend dominance.
ADX rising → strengthening trend (regardless of direction).
ADX falling → sideways or consolidating market.
Values above 80% → historically high / strong conditions.
Values below 20% → historically low / weak conditions or potential breakout setup.
Open-source script
In true TradingView spirit, the creator of this script has made it open-source, so that traders can review and verify its functionality. Kudos to the author! While you can use it for free, remember that republishing the code is subject to our House Rules.
Disclaimer
The information and publications are not meant to be, and do not constitute, financial, investment, trading, or other types of advice or recommendations supplied or endorsed by TradingView. Read more in the Terms of Use.