OPEN-SOURCE SCRIPT
Updated Relative Strength Range Rank
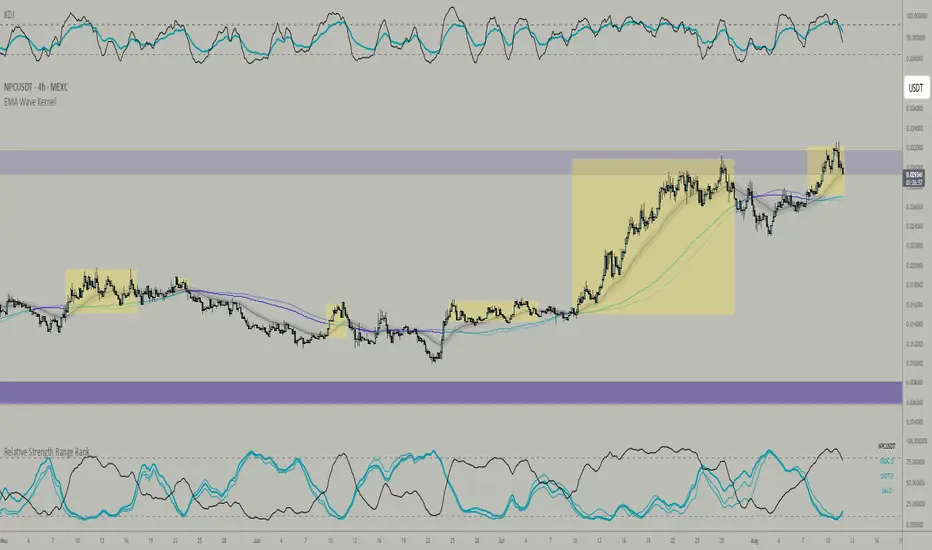
Relative Strength Range Rank – Chart Asset vs. Benchmarks
Description:
This indicator calculates and ranks the relative strength position of the current chart’s asset against up to five user-defined comparison symbols. By default, the comparison set is USDT.D, USDC.D and DAI.D.
Calculation method:
The same oscillator calculation is applied identically to the current chart’s asset and all comparison symbols:
For each symbol:
Determine the lowest low over LOWEST bars.
Determine the highest high over HIGHEST bars.
Calculate normalized position within range:
raw_osc = (close - lowest_low) / (highest_high - lowest_low) * 100
Apply a 10-period EMA to smooth raw_osc.
Invert and scale to match assets direction:
raw_osc = 100 - EMA_10(raw_osc)
Apply weighted smoothing:
smoothed = 0.191 * previous_value + 0.809 * current_value
Apply a final 1-period EMA to reduce jitter.
Output is the inverted smoothed oscillator value, representing the relative strength rank.
This function is implemented as calculate_oscillator() and used for all input symbols plus the current chart symbol, ensuring consistency in comparative analysis.
Plotting:
Each comparison symbol oscillator is plotted in the indicator pane.
The current chart oscillator is always plotted in black.
Alert condition:
Boolean chart_osc_above_all is true when the current chart oscillator is strictly greater than all other comparison oscillator values.
The alert chart_osc_crossed_above triggers only on the first bar where chart_osc_above_all changes from false to true.
Smoothing advantage:
The smoothing sequence (EMA → weighted smoothing → EMA) is designed to reduce short-term noise while preserving responsiveness to changes in price position.
The initial EMA(10) filters random fluctuations.
The weighted smoothing step (0.191 * prev + 0.809 * current) reduces overshoot and dampens oscillations without introducing significant lag, unlike longer EMAs.
The final EMA(1) step ensures stability in the plotted oscillator without visible jaggedness.
This combination yields a signal that is both smooth and reactive, making relative strength comparisons more precise.
Inputs:
Sym 1–5: up to five comparison tickers.
Lowest low lookback period (LOWEST).
Highest high lookback period (HIGHEST).
Color for plotted comparison lines.
Output:
Oscillator values from 0 to 100, where higher values indicate that the asset’s current price is closer to the highest high of the lookback period, and lower values indicate proximity to the lowest low.
Sorted table showing all selected assets ranked by oscillator value.
Optional alert when the current chart asset leads all selected assets in oscillator value.
Short Description:
Computes range-normalized oscillator values for the chart asset and up to 5 symbols, using EMA and weighted smoothing to reduce noise while preserving responsiveness; optional alert when the chart asset exceeds all others.
Release Notes
Color selection for current chart was not updating the corresponding table cell text color. FixedOpen-source script
In true TradingView spirit, the creator of this script has made it open-source, so that traders can review and verify its functionality. Kudos to the author! While you can use it for free, remember that republishing the code is subject to our House Rules.
Disclaimer
The information and publications are not meant to be, and do not constitute, financial, investment, trading, or other types of advice or recommendations supplied or endorsed by TradingView. Read more in the Terms of Use.
Open-source script
In true TradingView spirit, the creator of this script has made it open-source, so that traders can review and verify its functionality. Kudos to the author! While you can use it for free, remember that republishing the code is subject to our House Rules.
Disclaimer
The information and publications are not meant to be, and do not constitute, financial, investment, trading, or other types of advice or recommendations supplied or endorsed by TradingView. Read more in the Terms of Use.