OPEN-SOURCE SCRIPT
Updated RSI Buy/Sell Signals
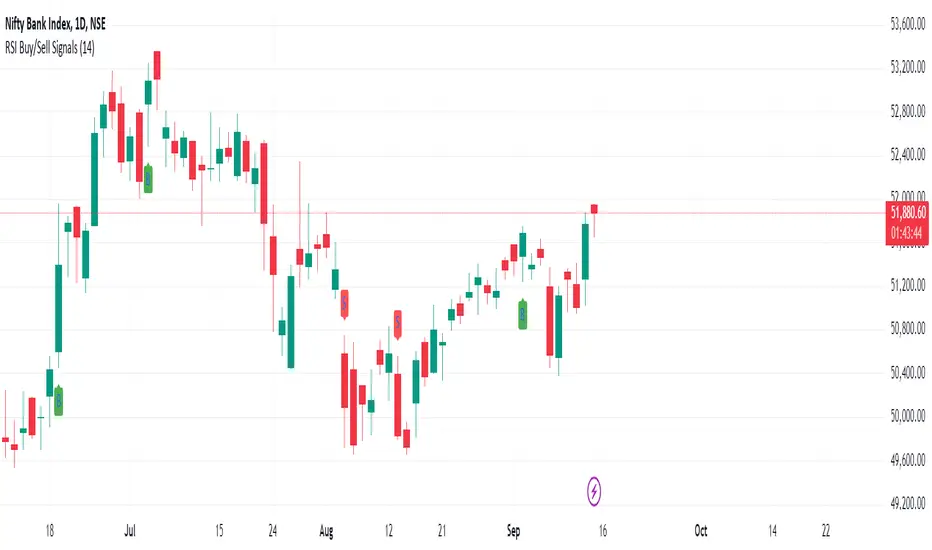
This Pine Script is designed to plot Buy and Sell signals based on the Relative Strength Index (RSI) for both 15-minute and hourly timeframes. It calculates the RSI values for the current 15-minute chart and requests the hourly RSI data for comparison. Buy signals are generated when the RSI crosses above 60 in either timeframe, while sell signals occur when the RSI crosses below 40. The script also plots visual markers on the chart, indicating buy signals with green labels below the price bars and sell signals with red labels above the price bars. Additionally, it allows for alert conditions, notifying the user when a buy or sell signal is triggered.
Release Notes
Added option to change RSI timeframeRelease Notes
Target addedRelease Notes
Minor ChangesRelease Notes
Minor ChangesOpen-source script
In true TradingView spirit, the creator of this script has made it open-source, so that traders can review and verify its functionality. Kudos to the author! While you can use it for free, remember that republishing the code is subject to our House Rules.
Disclaimer
The information and publications are not meant to be, and do not constitute, financial, investment, trading, or other types of advice or recommendations supplied or endorsed by TradingView. Read more in the Terms of Use.
Open-source script
In true TradingView spirit, the creator of this script has made it open-source, so that traders can review and verify its functionality. Kudos to the author! While you can use it for free, remember that republishing the code is subject to our House Rules.
Disclaimer
The information and publications are not meant to be, and do not constitute, financial, investment, trading, or other types of advice or recommendations supplied or endorsed by TradingView. Read more in the Terms of Use.