OPEN-SOURCE SCRIPT
Updated Volatility & Big Market Moves
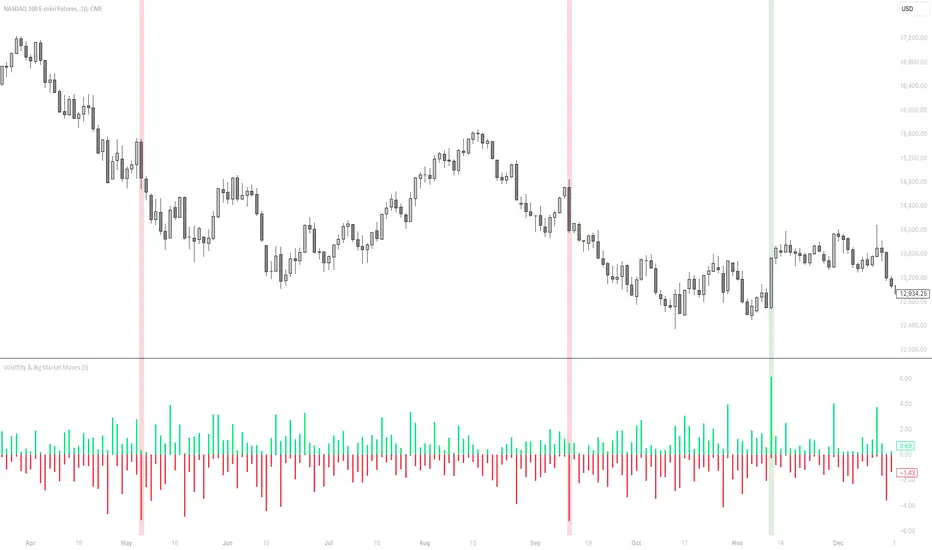
This indicator shows the volatility per candle, and highlights candles where volatility exceeds a defined threshold.
Data shown:
Furthest %-distance from the previous candle's closing price to the top (positive histogram).
Furthest %-distance from the previous candle's closing price to the bottom (negative histogram).
Data shown:
Furthest %-distance from the previous candle's closing price to the top (positive histogram).
Furthest %-distance from the previous candle's closing price to the bottom (negative histogram).
Release Notes
Slightly adjusted the calculation to calculate from the previous candle close instead of the current candle's high/low.Release Notes
"na" values in the histogram are now replaced with 0, so that the label on the scale shows the current candle's value at any time.Open-source script
In true TradingView spirit, the creator of this script has made it open-source, so that traders can review and verify its functionality. Kudos to the author! While you can use it for free, remember that republishing the code is subject to our House Rules.
Disclaimer
The information and publications are not meant to be, and do not constitute, financial, investment, trading, or other types of advice or recommendations supplied or endorsed by TradingView. Read more in the Terms of Use.
Open-source script
In true TradingView spirit, the creator of this script has made it open-source, so that traders can review and verify its functionality. Kudos to the author! While you can use it for free, remember that republishing the code is subject to our House Rules.
Disclaimer
The information and publications are not meant to be, and do not constitute, financial, investment, trading, or other types of advice or recommendations supplied or endorsed by TradingView. Read more in the Terms of Use.