OPEN-SOURCE SCRIPT
Bullish Bearish Signal with EMA Color + Labels
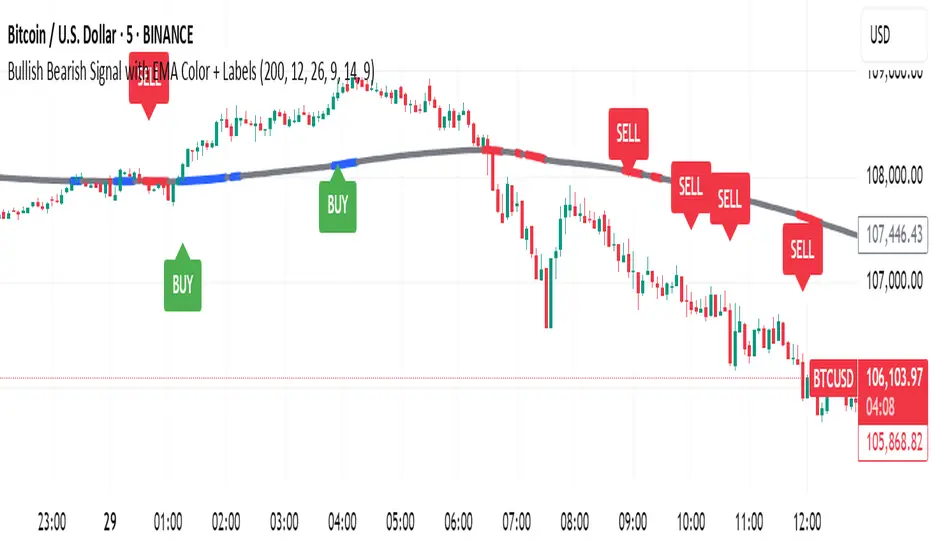
This script generates clear BUY and SELL signals based on a combination of trend direction, momentum, and confirmation from multiple indicators. It is intended to help traders identify strong bullish or bearish conditions using commonly trusted tools: EMA 200, MACD, and RSI.
🔍 How it works:
The strategy combines three key elements:
EMA 200 Trend Filter
Identifies the long-term trend:
Price above EMA200 → Bullish trend bias
Price below EMA200 → Bearish trend bias
The EMA line is color-coded:
🔵 Blue for bullish
🔴 Red for bearish
⚪ Gray for neutral/unclear
MACD Crossover
Detects shifts in market momentum:
Bullish: MACD line crosses above signal line
Bearish: MACD line crosses below signal line
RSI Confirmation
Adds an extra layer of confirmation:
Bullish: RSI is above its signal line
Bearish: RSI is below its signal line
✅ Signal Logic:
BUY Signal appears when:
Price > EMA200
MACD crosses up
RSI > its signal line
SELL Signal appears when:
Price < EMA200
MACD crosses down
RSI < its signal line
Labels will appear on the chart to highlight these events.
🔔 Alerts:
The script includes alerts for both Buy and Sell conditions, so you can be notified in real-time when they occur.
📈 How to Use:
Best used in trending markets.
Recommended for higher timeframes (1H and above).
May be combined with other tools such as support/resistance or candlestick analysis.
⚠️ Disclaimer: This script is intended for educational purposes only and does not constitute financial advice or a trading recommendation.
Open-source script
In true TradingView spirit, the creator of this script has made it open-source, so that traders can review and verify its functionality. Kudos to the author! While you can use it for free, remember that republishing the code is subject to our House Rules.
Disclaimer
The information and publications are not meant to be, and do not constitute, financial, investment, trading, or other types of advice or recommendations supplied or endorsed by TradingView. Read more in the Terms of Use.