OPEN-SOURCE SCRIPT
Donchian RSI Bands
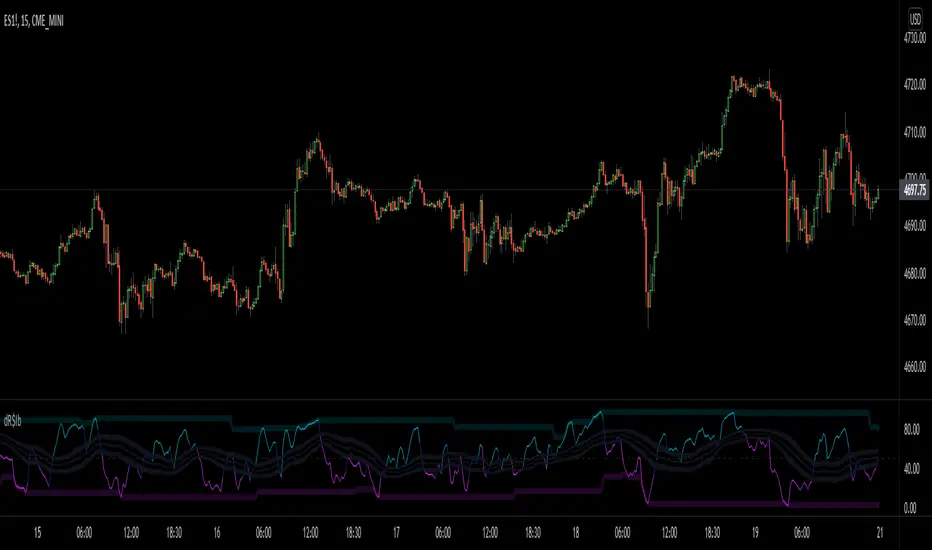
This little mashup of mine is called the Donchian RSI Bands. It consists of two RSI's, a Donchian Channel, & Bollinger bands, which can all be turned on or off depending on your preferences.
The main RSI is set to the 7 length and the second RSI is set to the default 14 length. When used together, they form an RSI cloud.
The Bollinger Bands are set to the 35 length and use two sets of adjustable deviations to form the bands. The inner band is set to 0.25 deviation and the outside is set to 0.5. Generally, the Bollinger Bands deviation is set to 2 but for this idea, when the RSI is inside the Bollinger Bands, there's a higher possibility of chop. The stronger Bullish or Bearish trend will be when the main RSI is trending above or below the Bollinger Bands.
The RSI color is Bullish when the RSI is above the Upper Bollinger Band, Neutral when the RSI is inside the Bands, and Bearish when the RSI is below the lower Bollinger Band. The wider you adjust the Outer Band Deviation, the wider the Neutral zone will be. The width of the Bollinger Band Basis can also be adjusted so you could widen it all the way out to the Bands which will form a fully shaded channel to avoid trading when the RSI is trending inside.
The Donchian Channel is set to 70, which 2x the Bollinger Band length. I use it for longer term trends and possible trend reversals.


There are 3 options for Barcoloring:
RSI Bollinger Bands

RSI Cloud

& when the RSI is above/below the Donchian Channel Basis

The main RSI is set to the 7 length and the second RSI is set to the default 14 length. When used together, they form an RSI cloud.
The Bollinger Bands are set to the 35 length and use two sets of adjustable deviations to form the bands. The inner band is set to 0.25 deviation and the outside is set to 0.5. Generally, the Bollinger Bands deviation is set to 2 but for this idea, when the RSI is inside the Bollinger Bands, there's a higher possibility of chop. The stronger Bullish or Bearish trend will be when the main RSI is trending above or below the Bollinger Bands.
The RSI color is Bullish when the RSI is above the Upper Bollinger Band, Neutral when the RSI is inside the Bands, and Bearish when the RSI is below the lower Bollinger Band. The wider you adjust the Outer Band Deviation, the wider the Neutral zone will be. The width of the Bollinger Band Basis can also be adjusted so you could widen it all the way out to the Bands which will form a fully shaded channel to avoid trading when the RSI is trending inside.
The Donchian Channel is set to 70, which 2x the Bollinger Band length. I use it for longer term trends and possible trend reversals.
There are 3 options for Barcoloring:
RSI Bollinger Bands
RSI Cloud
& when the RSI is above/below the Donchian Channel Basis
Open-source script
In true TradingView spirit, the creator of this script has made it open-source, so that traders can review and verify its functionality. Kudos to the author! While you can use it for free, remember that republishing the code is subject to our House Rules.
Disclaimer
The information and publications are not meant to be, and do not constitute, financial, investment, trading, or other types of advice or recommendations supplied or endorsed by TradingView. Read more in the Terms of Use.