OPEN-SOURCE SCRIPT
Updated High/Low last 1-3 candles
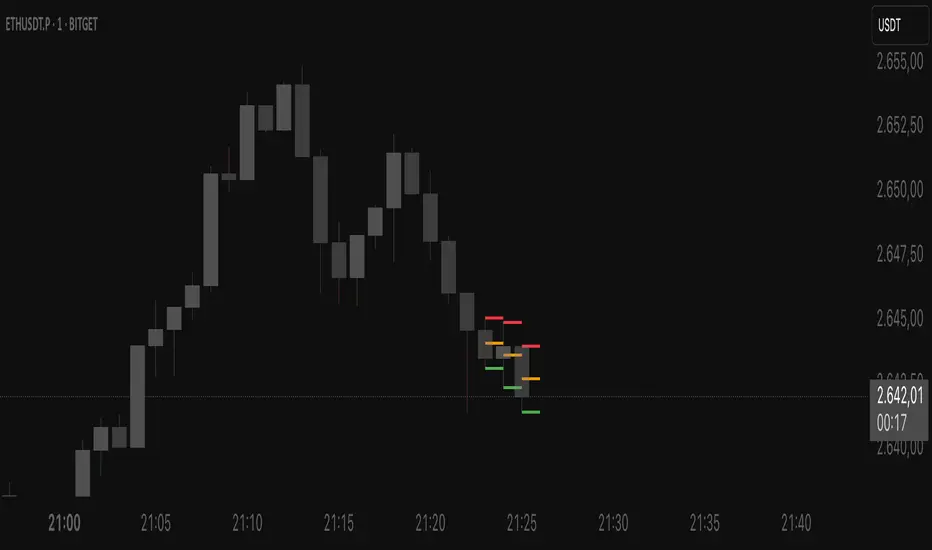
Here you can display the high and low of the last 1, 2 or 3 candles. The whole thing is updated with every new candle. you can also switch the lines on or off as you wish and adjust the colour of the lines. have fun with it
Release Notes
Dynamic Candle Levels — High/Low & 50% Lines LiveThis indicator dynamically visualizes the key price levels of the current and recent candles in real-time.
Automatically draws lines at the highs and lows of the last X candles
Marks the 50% level of each candle with horizontal lines
Updates the lines of the currently forming candle live as high, low, and midpoint change
Fully customizable colors, line widths, and number of displayed candles
Perfect for quickly identifying support and resistance zones or intermediate levels at a glance to make faster trading decisions.
Settings:
Number of candles for high/low and 50% lines
Colors and widths of the lines
Option to show live lines for the current candle
Open-source script
In true TradingView spirit, the creator of this script has made it open-source, so that traders can review and verify its functionality. Kudos to the author! While you can use it for free, remember that republishing the code is subject to our House Rules.
Disclaimer
The information and publications are not meant to be, and do not constitute, financial, investment, trading, or other types of advice or recommendations supplied or endorsed by TradingView. Read more in the Terms of Use.