OPEN-SOURCE SCRIPT
Return Volatility (σ) — auto-annualized [v6]
Overview
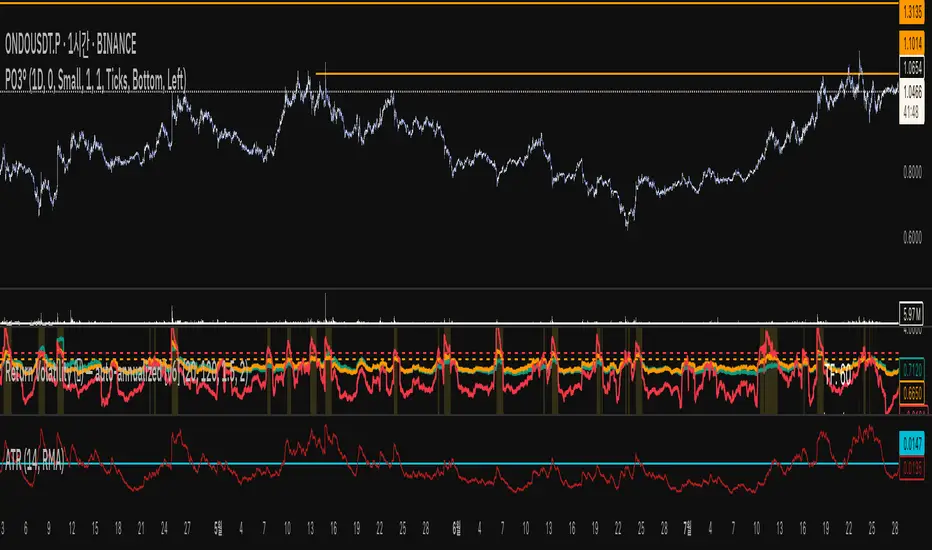
This indicator calculates and visualizes the return-based volatility (standard deviation) of any asset, automatically adjusting for your chart's timeframe to provide both absolute and annualized volatility values.
It’s designed for traders who want to filter trades, adjust position sizing, and detect volatility events based on statistically significant changes in market activity.
Key Features
Absolute Volatility (abs σ%) – Standard deviation of returns for the current timeframe (e.g., 1H, 4H, 1D).
Annualized Volatility (ann σ%) – Converts abs σ% into an annualized figure for easier cross-timeframe and cross-asset comparison.
Relative Volatility (rel σ) – Ratio of current volatility to the long-term average (default: 120 periods).
Z-Score – Number of standard deviations the current volatility is above or below its historical average.
Auto-Timeframe Adjustment – Detects your chart’s bar size (seconds per bar) and calculates bars/year automatically for crypto’s 24/7 market.
Highlight Mode – Optional yellow background when volatility exceeds set thresholds (rel σ ≥ threshold OR z-score ≥ threshold).
Alert Conditions – Alerts trigger when relative volatility or z-score exceed defined limits.
How It Works
Return Calculation
Log returns: ln(Pt / Pt-1) (default)
or Simple returns: (Pt / Pt-1) – 1
Volatility Measurement
Standard deviation of returns over the lookback period N (default: 20 bars).
Absolute volatility = σ × 100 (% per bar).
Annualization
Uses: σₐₙₙ = σ × √(bars/year) × 100 (%)
Bars/year auto-calculated based on timeframe:
1H = 8,760 bars/year
4H ≈ 2,190 bars/year
1D = 365 bars/year
Relative and Statistical Context
Relative σ = Current σ / Historical average σ (baseLen, default: 120)
Z-score = (Current σ – Historical average σ) / Std. dev. of σ over baseLen
Trading Applications
Volatility Filter – Only allow trade entries when volatility exceeds historical norms (trend traders often benefit from this).
Risk Management – Reduce position size during high volatility spikes to manage risk; increase size in low-volatility trending environments.
Market Scanning – Identify assets with the highest relative volatility for momentum or breakout strategies.
Event Detection – Highlight significant volatility surges that may precede large moves.
Suggested Settings
Lookback (N): 20 bars for short/medium-term trading.
Base Length (M): 120 bars to establish long-term volatility baseline.
Relative Threshold: 1.5× baseline σ.
Z-score Threshold: ≥ 2.0 for statistically significant volatility shifts.
Use Log Returns: Recommended for more consistent scaling across prices.
Notes & Limitations
Volatility measures movement magnitude, not direction. Combine with trend or momentum filters for directional bias.
Very low volatility may still produce false breakouts; combine with volume and market structure analysis.
Crypto markets trade 24/7 — annualization assumes no market closures; adjust for other asset classes if needed.
💡 Best Practice: Use this indicator as a pre-trade filter for breakout or trend-following strategies, or as a risk control overlay in mean-reversion systems.
Open-source script
In true TradingView spirit, the creator of this script has made it open-source, so that traders can review and verify its functionality. Kudos to the author! While you can use it for free, remember that republishing the code is subject to our House Rules.
Disclaimer
The information and publications are not meant to be, and do not constitute, financial, investment, trading, or other types of advice or recommendations supplied or endorsed by TradingView. Read more in the Terms of Use.