OPEN-SOURCE SCRIPT
Updated God's Little Finger
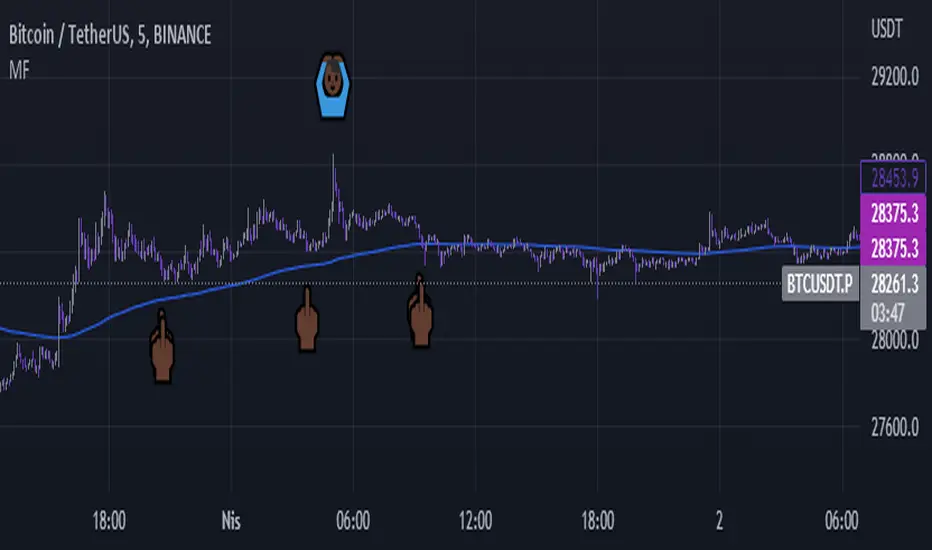
The "God's Little Finger" indicator uses several technical analysis tools to provide information about the direction of the market and generate buy/sell signals. These tools include a 200-period exponential moving average (EMA), Moving Average Convergence Divergence (MACD), Bollinger Bands, and the Relative Strength Index (RSI).
EMA is used to determine if prices are trending. MACD measures the speed and momentum of the trend. Bollinger Bands are used to determine if prices are staying within a range and to measure the strength of the trend. RSI shows overbought/oversold levels and can be used to determine if the trend will continue.
The indicator generates buy/sell signals based on market conditions. A buy signal is generated when the MACD line is below zero, the price is below the lower boundary of the Bollinger Bands, the price is above the 200-period EMA, and the RSI is in oversold levels (usually below 40). A sell signal is generated when the MACD line is above zero, the price is above the upper boundary of the Bollinger Bands, the price is below the 200-period EMA, and the RSI is in overbought levels (usually above 60).
However, it should be noted that indicators can be used to predict market conditions, but they do not guarantee results and any changes or unexpected events in the market can affect predictions. Therefore, they should always be used in conjunction with other analysis methods and risk management strategies.
Release Notes
I changed the sell condition this sell condution includes ATR for short signal.Release Notes
ema is visible nowOpen-source script
In true TradingView spirit, the creator of this script has made it open-source, so that traders can review and verify its functionality. Kudos to the author! While you can use it for free, remember that republishing the code is subject to our House Rules.
Disclaimer
The information and publications are not meant to be, and do not constitute, financial, investment, trading, or other types of advice or recommendations supplied or endorsed by TradingView. Read more in the Terms of Use.
Open-source script
In true TradingView spirit, the creator of this script has made it open-source, so that traders can review and verify its functionality. Kudos to the author! While you can use it for free, remember that republishing the code is subject to our House Rules.
Disclaimer
The information and publications are not meant to be, and do not constitute, financial, investment, trading, or other types of advice or recommendations supplied or endorsed by TradingView. Read more in the Terms of Use.