OPEN-SOURCE SCRIPT
Money Flow based probability
Money Flow based probability
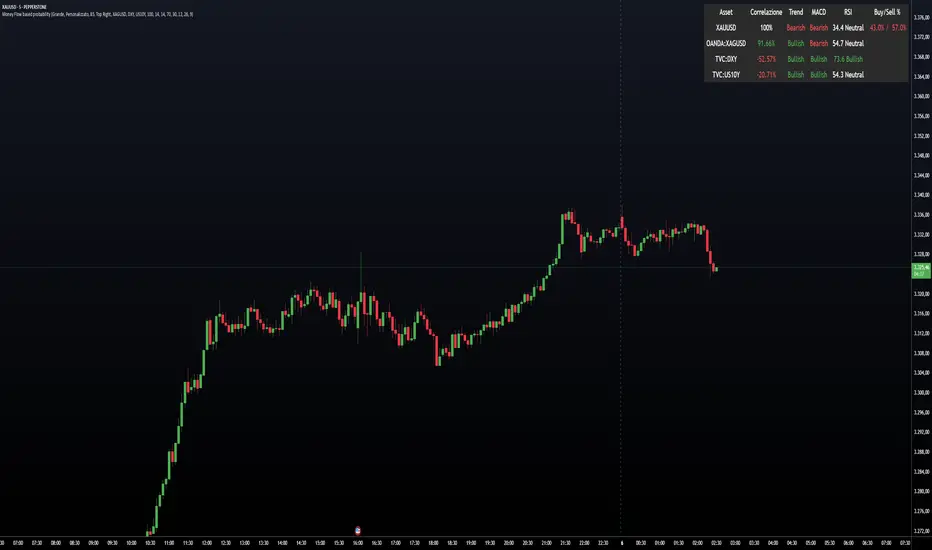
This indicator provides a comprehensive correlation and momentum analysis between your main asset and up to three selected correlated assets. It combines correlation, trend, momentum, and overbought/oversold signals into a single, easy-to-read table directly on your chart.
This indicator is ideal for traders who want to quickly assess the influence of major correlated markets and technical signals on their trading instrument, all in a single glance.
---
Example: Correlation Calculation
Pine Script®
Example: Table Output (Buy/Sell %)
Pine Script®
This indicator provides a comprehensive correlation and momentum analysis between your main asset and up to three selected correlated assets. It combines correlation, trend, momentum, and overbought/oversold signals into a single, easy-to-read table directly on your chart.
- Correlated Asset Selection:
You can select up to three correlated assets (e.g., indices, currencies, bonds) to compare with your main chart symbol. Each asset can be toggled on or off. - Correlation Calculation:
The indicator uses the native Pine Scriptfunction to measure the statistical relationship between the closing prices of your asset and each selected pair over a user-defined period.Pine Script® ta.correlation - Technical Analysis Integration:
For each asset (including the main one), the indicator calculates:
Trend direction using EMA (Exponential Moving Average) – optional
Momentum using MACD – optional
Overbought/oversold status using RSI – optional - Probability Scoring:
A weighted scoring system combines correlation, trend, MACD, RSI, and trend exhaustion signals to produce buy and sell probabilities for the main asset. - Visual Table Output:
A customizable table is displayed on the chart, showing:
Asset name
Correlation (as a percentage, -100% to +100%)
Trend (Bullish/Bearish)
MACD status (Bullish/Bearish)
RSI value and status
Buy/Sell probability (with fixed-width formatting for stability) - User Customization:
You can adjust:- Table size, color, and position
- Correlation period
- EMA, MACD, and RSI parameters
- Which assets to display
- Table size, color, and position
This indicator is ideal for traders who want to quickly assess the influence of major correlated markets and technical signals on their trading instrument, all in a single glance.
---
Example: Correlation Calculation
corrCurrentAsset1 = ta.correlation(close, asset1Data, correlationPeriod)
Example: Table Output (Buy/Sell %)
buyStr = f_formatPercent(buyProbability) + "%"
sellStr = f_formatPercent(sellProbability) + "%"
cellStr = buyStr + " / " + sellStr
Open-source script
In true TradingView spirit, the creator of this script has made it open-source, so that traders can review and verify its functionality. Kudos to the author! While you can use it for free, remember that republishing the code is subject to our House Rules.
Disclaimer
The information and publications are not meant to be, and do not constitute, financial, investment, trading, or other types of advice or recommendations supplied or endorsed by TradingView. Read more in the Terms of Use.