OPEN-SOURCE SCRIPT
Pivot Web
The Pivot Web is a prototype with its base derived from TradingView's standard pivot point indicator plus inspiration from LuxAlgo's trendline work alongside my own observations/experiences.
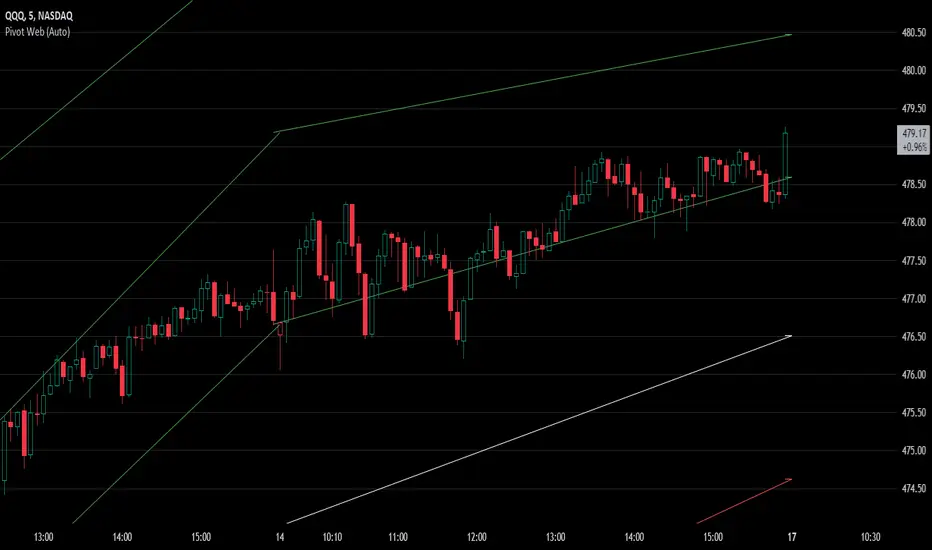
The theory is that there's legitimacy, from a technical standpoint, pivot point calculations are an adequate gauge of momentum and sentiment because the same math was used under pressure by floor traders themselves. That calculation is centered on the average of high, low, and closing prices. This indicator creates trendlines connecting the last pivot, support, and resistance levels to the current ones. A dynamic visual cue could make it easier to assess if the price will continue or reverse the current trajectory. This method also shows us an excellent visual for volatility.
Key Takeaways:
Lastly, note the first set of data in each new timeframe displays the current original pivot point levels along with the trendlines attached to their ending point. Most of the time this indicator leaves room by briefly highlighting the original static levels with all levels also being optional displays. Also note that a more stable asset may not require the outermost support and resistance levels. Like most time series analysis tools, the Pivot Web requires current data to function properly.
"Nature is pleased with simplicity, and nature is no dummy."
The theory is that there's legitimacy, from a technical standpoint, pivot point calculations are an adequate gauge of momentum and sentiment because the same math was used under pressure by floor traders themselves. That calculation is centered on the average of high, low, and closing prices. This indicator creates trendlines connecting the last pivot, support, and resistance levels to the current ones. A dynamic visual cue could make it easier to assess if the price will continue or reverse the current trajectory. This method also shows us an excellent visual for volatility.
Key Takeaways:
- This indicator draws new dynamic trendlines.
- These new trendlines connect the past and present pivot point levels based on the timeframe you select.
Shorter timeframes = More trendlines
- Price adherence to the path of these lines may offer insight for trading.
Lastly, note the first set of data in each new timeframe displays the current original pivot point levels along with the trendlines attached to their ending point. Most of the time this indicator leaves room by briefly highlighting the original static levels with all levels also being optional displays. Also note that a more stable asset may not require the outermost support and resistance levels. Like most time series analysis tools, the Pivot Web requires current data to function properly.
"Nature is pleased with simplicity, and nature is no dummy."
Open-source script
In true TradingView spirit, the creator of this script has made it open-source, so that traders can review and verify its functionality. Kudos to the author! While you can use it for free, remember that republishing the code is subject to our House Rules.
KP
Disclaimer
The information and publications are not meant to be, and do not constitute, financial, investment, trading, or other types of advice or recommendations supplied or endorsed by TradingView. Read more in the Terms of Use.